No matter what trading system or charting type a trader follows, there are basically 4 simple questions that determine the decision to trade. The question of subjectivity too often can turn a winning analysis or trade into a losing one. Thankfully though, trading with renko charts can be very objective, depending on how you look at them. The following questions illustrate how they can help traders to be on the right side of the trade and also be confident in their trading:
- Which direction to trade
- Which price to enter
- What price to exit in profits
- Where to limit the losses
These four questions are simple yet as can be seen requires a lot of patience, due diligence in analyzing the charts and the markets. With Renko charts, such an objective trading approach is quite possible due to the structure of the Renko charts themselves. For those new to Renko trading, it is essential to understand what makes a Renko box or brick.
A Renko brick/box is formed ONLY when price closes above the specified box range. In other words, spikes, often seen in candlesticks and bar charts are completely ignored.
This structure of Renko charting is what makes it possible for a trader to approach trading with Renko charts in a very objective way. So let’s take a look at how Renko charts can answer the above four questions.
Which direction to trade
This question determines the market sentiment or bias. In other words; the trend. Assuming that the trader prefers to trade with the trade, this question basically asks whether to go long or short. In other words, is the prevailing trend in an uptrend or a down trend?
This can be determined by first looking at a higher box size Renko charts. Trends in Renko come in two forms… Swing, or long term trends and the intermediary trends. The chart below explains the differences between the two.
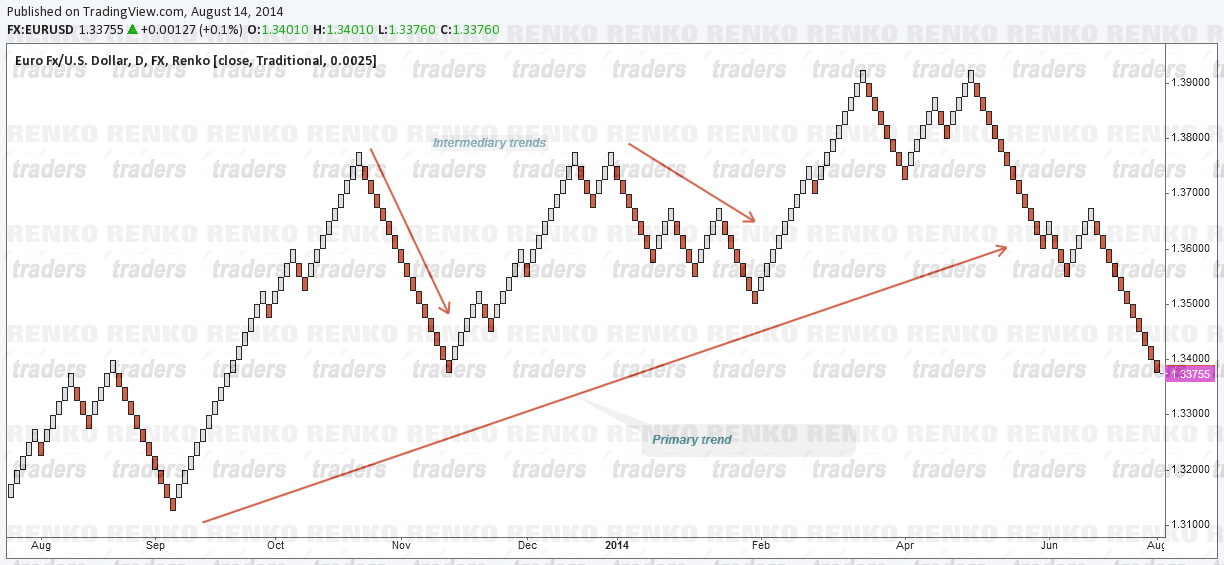
The main or primary trend is a very long term trend as can be seen by the series of higher lows and higher highs price was making. Within this long term trend, we notice intermediary trends where we see how price has been making retracements or pullbacks to the primary trends.
Understanding the differences between these two types of Renko trends gives traders a better perspective on their trading bias. For example, trend following traders could look for potential end of retracements for initiating long positions.
Which price to enter?
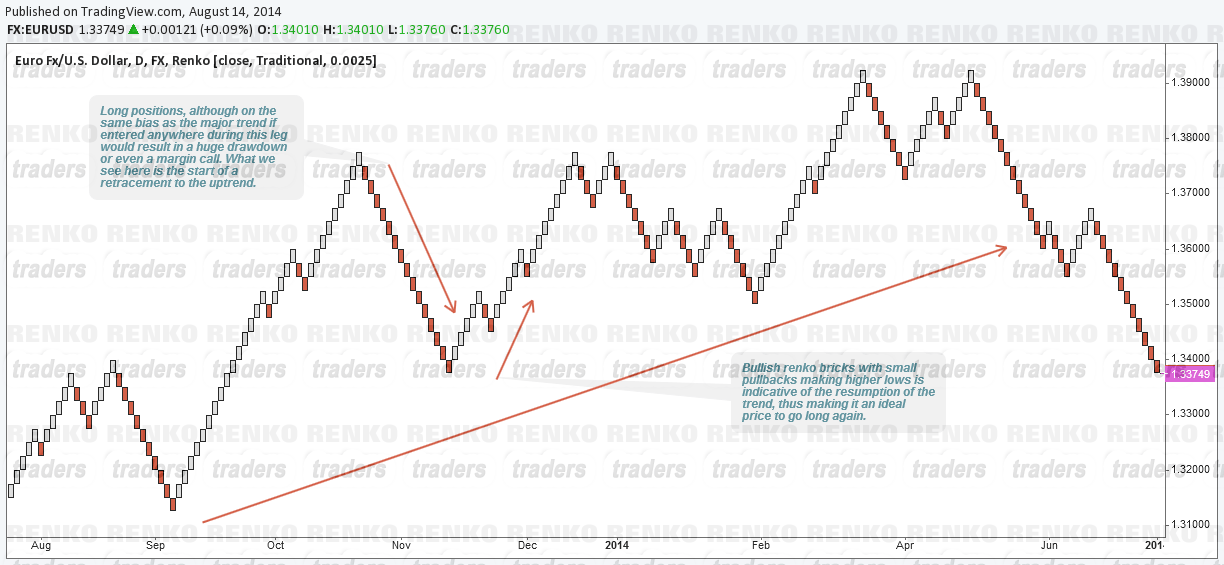
When entering a position, long or short, the question a trader should ask is, if the price they are entering at is an ideal price to buy or sell. For example, a trend might be in a downtrend and just started its retracement. So, a short position, although correct in terms of the longer bias would result in a huge drawdown until the retracement is completed. By asking the question of which is the ideal price to enter a trade would ensure that new positions are entered at key support/resistance levels or when price is showing signs of completing the retracement.
What price to exit in profits
This next question basically determines how long you want to hold on to your trade for and what would be the most ideal price to exit without cutting the trade too early or keeping the trade open for too long. The chart below, we notice how the deep retracement to the uptrend ended and price starts making small pullbacks after resuming the major trend.

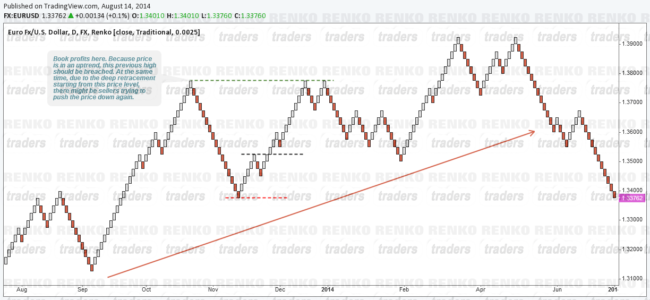
While this might be an ideal price level to go long, profits could be determined based on previous price action history as shown on the Renko chart. Notice the high that was made just before the deep retracement starts. This would ideally be a level to take profits for long positions as it not only marks the high before the retracement, but also the fact that potential sellers could come in here in order to push price down again.
Noticeable, price makes a double top pattern and starts yet another retracement to the uptrend.
Where to limit the losses
Limiting losses is essential. Not only do they help protect your equity, stop loss orders help in limiting the losses when the bias or analysis turns out to be wrong. Most traders are generally taught to take on low risk high probability trades. However such trades although look good in hindsight requires a lot of experience when trading as price action unfolds.
Observe the below chart for example. Notice how price starts the second retracement, ending at the same price from the previous trade. This occurs because price is in an uptrend. Ideally, price should not drop lower than the two intermediary stop levels on the chart. If price breaks both these levels, it would be indicative of an even deeper retracement. This would in turn help traders to exit with a manageable loss.

Trading with Renko Charts objectively
From the above, we can notice how Renko charts can help traders to manage their trades without being too subjective. Don’t forget to ask yourself the right questions every time you trade. This ensures that you are trading side of the price and not particularly married to a trade idea or analysis.
Renko charts can help you to stay objective (as much as possible). The difference is in knowing when to bring in your gut feel or subjectivity to the trade set up.