Renko chart software for trading Indian stocks is a lucrative way for traders to trade the equities listed on the stock exchanges in India. As the global economy continues to ease, growth in some of the developed economies have been slow.
Amid the cloud of concerns, developing or emerging markets such as India promise the lure of higher returns. In fact, reports over the past few years consistently point out to the fact that India is most likely to be the next engine of global growth.
Until now, China has the status of being the world’s growth engine. But India’s growth is set to take over in the coming years.
With a nation of over a billion in population, the Indian stock market offers traders lot of earning potential. Whether you are a long term investor or an intraday trader. In this article, we focus on how traders can use Renko charts for trading Indian stocks.
However, before we get into the details, a word of caution.
It is legal to day trade stocks in the Indian stock markets. Day traders need to have a DEMAT account. While there are no restrictions on the volume of trades one can place, there are however some restrictions by the brokers. When you day trade stocks in India there is no delivery of the stock as long as you close your position within the day. Traders are required to maintain an exposure margin in the event that they do not square off their positions.
Just like in the United States, there is also a pre-market session. This is usually for a span of 15-minutes before the market opens. The Indian equity markets open at 0900 and operate until 1530, Indian Standard Time (GMT+5). Unlike other equity markets, there are no lunch breaks and the markets operate at a stretch when they open.
Introduction to the Indian Stock Market
There are two main stock exchanges in India.
- The Bombay Stock Exchange (BSE)
- The National Stock Exchange (NSE)
The BSE is the oldest among the two stock exchanges. The BSE was established in 1875 while the NSE was founded in 1992 and became operational since 1994. Despite having two exchanges, both the National Stock Exchange and the Bombay Stock Exchange follow the same rules for listing and for trading.
Some of the biggest public companies trade on both the BSE and the NSE exchanges. When it comes to derivatives trading, the NSE takes the lead as it accounts for about 70% of spot trading and enjoys a monopoly when it comes to derivatives trading.
Both the NSE and the BSE constantly compete for market share leading to lower costs. One might think that with two exchanges, there is room for arbitrage. Yes, while this is true, the arbitrage between the two exchanges is relatively tight at almost all the times.
The BSE and the NSE rank number 10 and 11 as the world’s biggest exchanges based on market cap. The BSE boasts of a total market cap of $2.05 trillion while the NSE comes in hot on its heels at $2.03 trillion.
Indian Stock Market Indexes
There are two big names when it comes to the benchmark stock market indices. These are the Sensex and the NIFTY. Between the two, the Sensex is the oldest market index. It comprises of 30 firms that are trading on the BSE which is about 45% of the index’s free float market cap.
The NIFTY is the short name for the S&P CNX Nifty index. This index comprises of 50 stocks that are trading on the NSE and represents more than 60% of the free float market cap. The NIFTY index is endorsed by Standard & Poor’s and is similar to most other benchmark indexes created by Standard & Poor’s.
The NIFTY index is also commonly referred to as the NIFTY 50 index. There is a whole ecosystem around the NIFTY 50 index. This includes ETF’s and other OTC derivatives.
Renko Charts for Indian stocks
Day traders who trade the Indian stocks can make use of the Renko charts to get a different perspective of the market. Depending on the settings of your Renko chart, you can trade both Indian stocks as well as the main indexes.
The set up for the Renko charts for Indian stocks is quite easy. The chart below gives an example of Vodafone Idea Limited (IDEA.BSE).

The chart shows the default set up using the 14 period ATR. Read here on the difference between using ATR and fixed Renko brick size.
You can see that the chart set up is very clean and it shows the clear trends in the market with relative ease. The above chart of course, is based on the daily time frame.
The next chart shows that same stock but based on the intraday close of 1-hour.
")
Using the above set ups, traders can either swing trade or use intraday Renko trading strategies.
Renko Charts Nifty
The NIFTY or the NIFTY 50 index is no doubt one of the most popular indexes to trade. Besides the NIFTY 50, there are other indexes such as the Bank NIFTY index as well.
Using Renko charts, traders can find profitable day trading opportunities with relative ease. The next chart below shows the NIFTY 50 stock index based on the 5-minute close and use a fixed Renko box size of 15. The NIFTY 50 Renko chart shows price action in the most visual way possible.

In the NIFTY Renko chart, price breaks the trend line. It then starts to post a steady decline with the reversal taking place near the support level that you see on the chart.
NSE BSE Intraday trading with Renko Charts
Using the Renko charts which can be set to as little as one-minute, intraday traders can trade easily based on the stocks listed on the NSE or the BSE.
You can set up your own Renko charts for Indian stocks.
Open an account with Tradingview.com and select the Indian stock exchanges.
To be able to use the Renko charts and the lower time frame closes, you will need to opt for a Pro+ Account. This costs $29.95 a month or if you choose an annual plan, you get a discount of 17% which brings the monthly subscription cost to $24.95. So, for a yearly plan you would pay $299.40.
You can also get a two-year subscription plan which gives you a 33% discount. This comes to $19.95 a month or about $478.80. If you are a serious trader, then it is ideal to use a yearly subscription.
The Pro+ account allows you to create multiple layouts of the charts and you can also configure your chart settings.
For real time data to access the NSE and the BSE markets, there is an additional cost of $11 and $4 a month respectively for real time NSE and BSE market data.

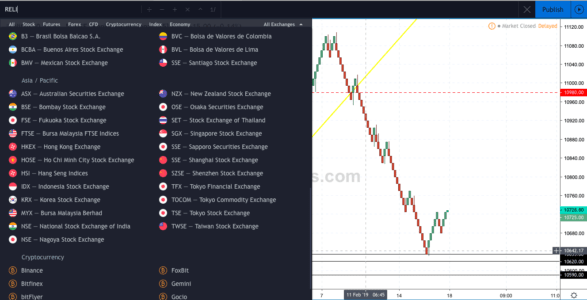
The above chart shows an example of how to select Indian equities for trading with Renko charts. You can simply enter the ticker and then filter down to select the exchanges which can be the NSE or the BSE.
Get online live Renko charts for Indian equities
Using the Tradingview.com Renko charts you can get online live Renko charts for Indian equity markets. If you are an avid trader and prefer the way Renko charts can be used to trade, then the amount is worth the investment. Click here to read a review of Tradingview.com
Within a short time, you should be able to see a return on investment for getting access to online live Renko charts for Indian equities. The fact that the Renko charting interface is available over the web browser means that whether you are using a Mac or a Windows laptop, you can access your Renko charts for Indian equities with ease.
Another benefit is that because the Renko charts for Indian equities are web-based, you can access your charts from just about anywhere, truly giving you the freedom to access and analysis Indian equity markets using Renko charts.
Have you been using the Renko charts for Indian equities? Let me know by leaving your comments on your feedback and any questions you might have!