The RSI Swing failure strategy is nothing new to the trading world and has been one of the ways to trade with the Relative Strength Index. The Renko RSI swing failure strategy is nothing but the same adaptation to the Renko charts. The main advantage of this method being that the swing failures are a lot easier to identify with Renko charts.
But before we get into the trading strategy details and examples let’s quickly recap the details of the RSI swing failure method.
RSI Swing Failure – Introduction
The RSI swing failure method works based on the entry triggers from the RSI indicator itself. The original method calls for a 14 period RSI being applied to the charts with the usual 70 and 30 levels.
Long positions are taken when the RSI drops below 30 to reverse and close back above 30. Then the RSI drops back lower, but stays above 30. When in the next few bars the RSI breaks the interim peak, long positions are taken.
Short positions are the exact opposite, where the RSI rises above 70 and makes a high and then reverses to close below 70. The RSI then reverses to make a smaller high but within 70. When the RSI breaks the interim low, short positions are taken.
More details and visual explanations are best illustrated by Stockcharts in this article.
Renko RSI Swing Failure Method
The same rules apply for Renko charts as well. However, because Renko charts work only with the closing prices, we wait for the interim peak or low to act as resistance.
The EURUSD chart below gives one such example.
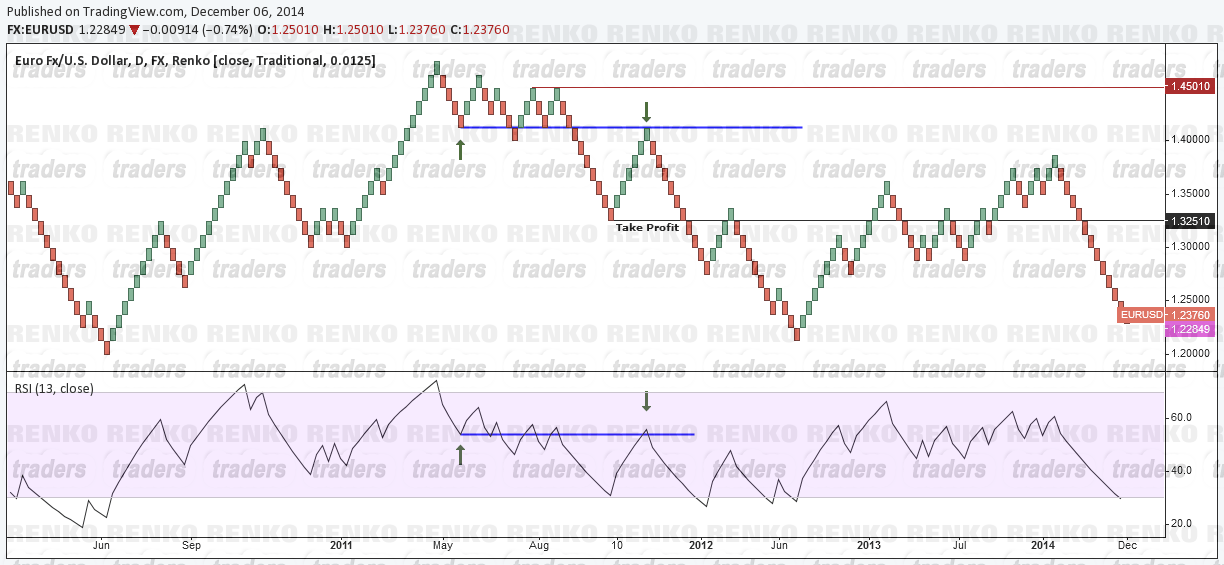
Here, we can see how RSI first rose above 70, making a high at 74.4 and then dips below 70 to form a low at 54. The RSI then rises above but remains within 70 level. By now we have a low, which marks our entry price. We just need to wait for both RSI and the Renko block to confirm the entry, which after a while we see the RSI rallies back to the same price level and then promptly reverses, as indicated by the two down arrows.
The take profit levels are predetermined based on the previous low made. Profits can be booked here or partial close with break even to let the profits roll.
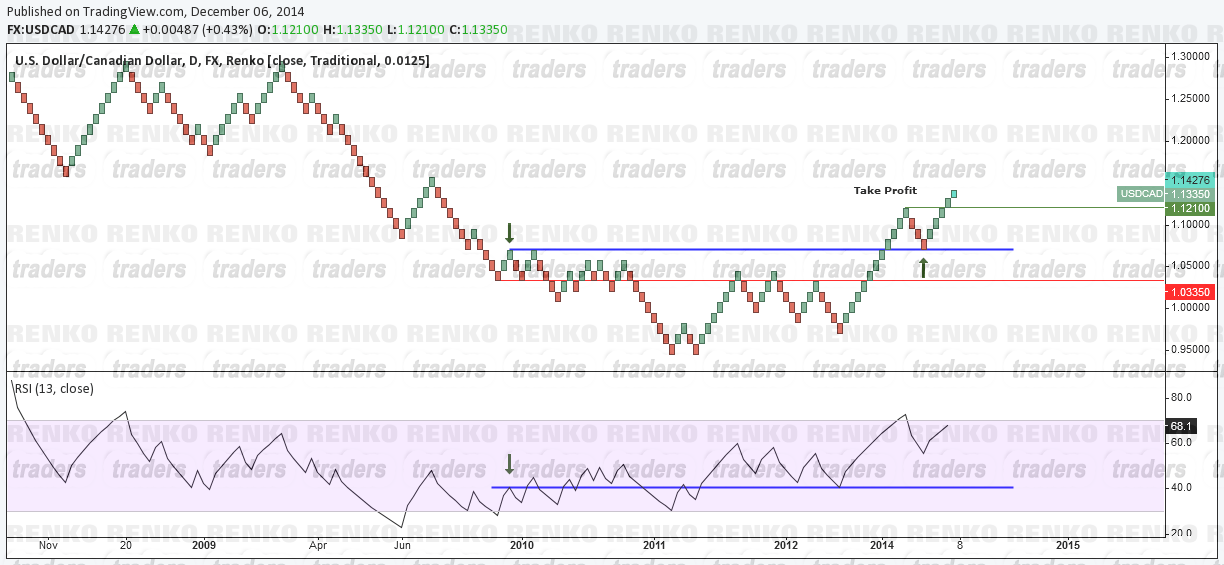
The next chart below shows the USDCAD. Here we see how the RSI first drops below 30, then rises to make a small peak, dips lower but stays above 30 and then rallies. After quite a while, we see price break above the peak, only to retest it for support and then rallies higher, breaking above the take profit level.
As we can see from the above two examples, the Renko RSI swing failure method is very simple and easy to trade because we combine it with support and resistance levels which are easier to stop with Renko charts.
The only downside being that after the trade conditions are set up, we will have to wait for quite a while in order for the entry to be triggered. It is therefore recommended to use this strategy on smaller renko brick sizes.
Another factor to bear in mind, as seen in the USDCAD long example above being that some times the swing failures can be invalidated. If we look closely, before the entry conditions triggered, the RSI had made another swing failure set up, where the RSI dropped to lows of 24.6 but the interim peak it made was much larger.
This strategy works best on smaller Renko block size such as 10/50 pips for forex.