
Last week was one of the worst trading weeks for the GBP in a week that was pressured the GBP lower both politically and from a trading point of view.
After Theresa May, the British PM announced that Article 50 will be invoked by March 2017, the pound fell on the news and remained weak but the declines accelerated by Friday and the flash crash during the Asian session or the “twilight zone” marked by thin liquidity. The GBP saw one of its worst trading weeks since the Brexit crash.
Data from the US on the other hand was vastly positive for the most part of the week. Both the ISM surveys rebounded in August but Friday’s jobs report remained soft. Despite a weak headline print of only 156k jobs compared to estimates of 170k, the overall picture was that of a healthy trend in the US labor market. So, the December rate hike is still on the table and the US dollar remains well bid to the upside.
Technical Outlook
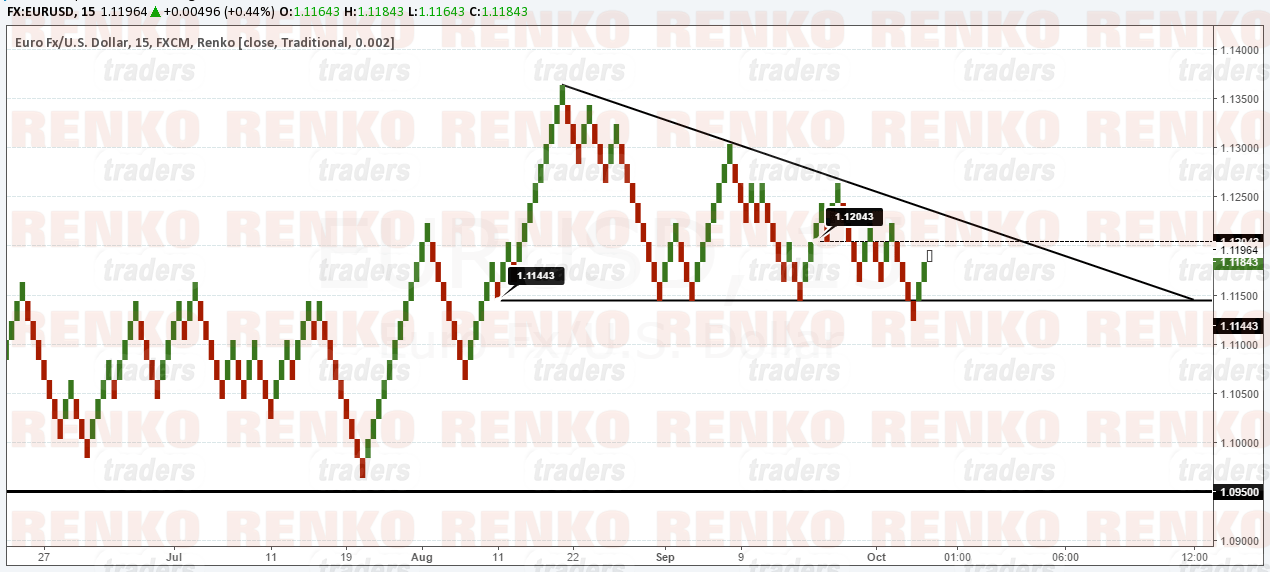
EURUSD: This week, we look at a 20 pip EURUSD chart. Due to the ranging nature of EURUSD, price action has been very limited leading to only short term trading opportunities. However, the 20 pip chart shows a descending triangle pattern that has been formed. The triangle support is formed at 1.1144 and price has tested this level nearly five times so far. The current move to the upside could culminate near 1.1204 region. If we get to see a reversal here, EURUSD could resume its declines back to the support at 1.1144 and a breakout here could send further declines towards 1.0950 (rounded off).
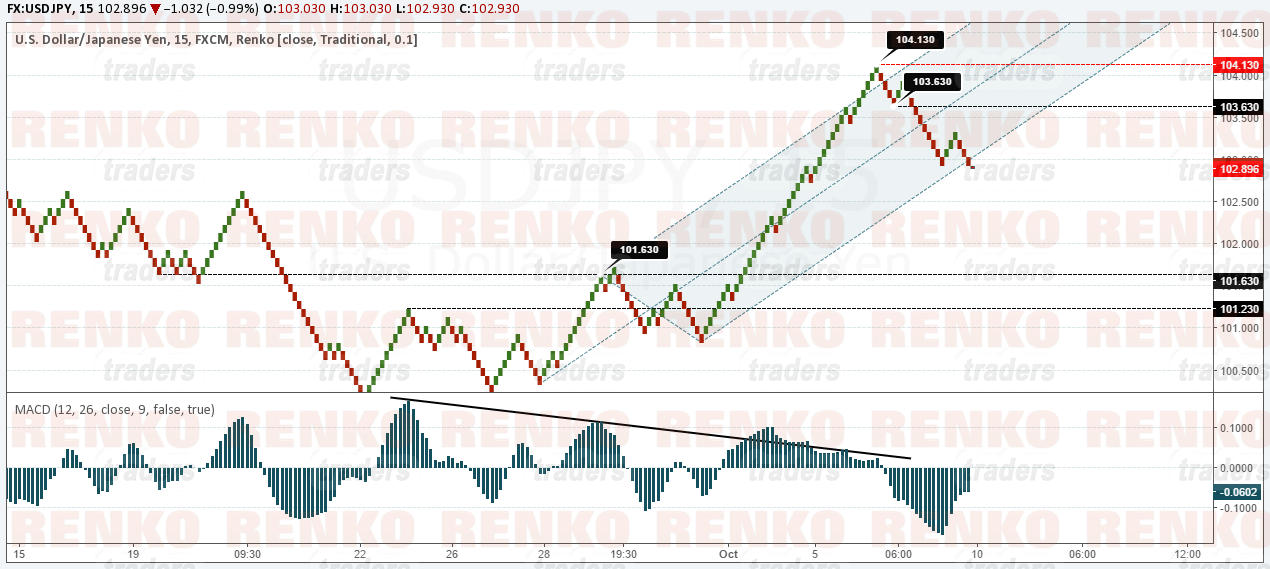
USDJPY: The 10 pip chart for USDJPY shows price action rapidly posting strong gains last week, sending the dollar towards the highs near 104.00. However, price promptly reversed off this resistance level closing Friday below the 103.00 level. We can expect a near term rebound in prices off the current level with the retracement likely to see USDJPY back near 103.630 level. A short position here could see the dollar slide back towards the support zone of 101.63 – 101.23 (a 40 pip support zone) based on the bearish divergence we find currently. The short position comes with a good risk/reward (check the chart with the ideal positions)
AUDUSD: AUDUSD broke down below the head and shoulders pattern neckline support level of 0.7609 and extended the declines to 0.7560 region. We expect to see further downside in AUDUSD with the head and shoulders pattern’s measured move target towards 0.7519. However, currently in the middle of the downtrend, waiting for a pullback is more ideal. The falling wedge pattern is essential to bear in mind which gives an upside target towards 0.76095 and the potential to move higher towards 0.76595. Position management is essential here and the bias remains strongly to the downside for 0.75195

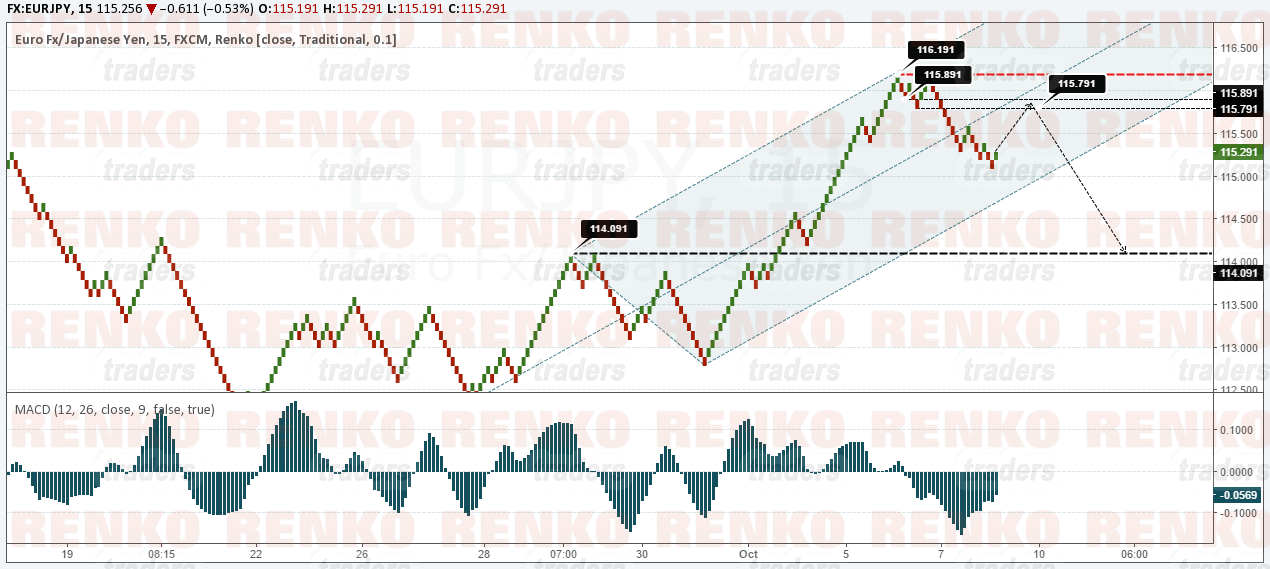
EURJPY: The price pattern in EURJPY is quite similar to that of USDJPY. The chart shows a near term pull back to the upside ahead of further declines towards 114.00. In the short term, expect EURJPY to reverse back from the current lows of 115.25 back to 115.89 – 115.79 region. If a lower high is formed here, expect EURJPY to decline towards 114.10 – 114.00 support level in the near medium term. The chart below shows the potential levels to trade.
Fundamental Outlook
The week is very quiet following last week’s busy schedule. There are no major economic releases that could impact the markets, therefore it will all come down to the market sentiment. Fundamental factors such as Brexit remain the major theme for the week ahead. In the US, PPI and retail sales will be the economic releases of interest while on Friday, Federal Reserve Chair, Janet Yellen will be speaking.