This advanced renko trading system is a combination of different indicators. I call this an advanced renko strategy because this is not your typical mechanical renko trading system.
The trading strategy, as going by the title requires three indicators for the trading strategy to work. On top of the three forex indicators, you also need to understand the concept of trends in the forex markets. Last but not the least, you need to have a little bit of experience in knowing how to trade using chart patterns.
If you think the above is enough, there’s one more. Risk management of course! You can get the best trading results when you combine the concepts of risk management and a good trading system.
Another point to mention about this advanced renko trading system is the fact that you will not get consecutive buy or sell signals. On the contrary, the trading signals can be generated randomly. You should get to a point where you are able to pick and choose the set ups.
What this means for you as a trader is that you might need to keep an eye on the charts for this strategy to work. As a result, this advanced renko trading system sits between a renko scalping system and renko swing trading system.
For illustration purposes, I will focus on the EURUSD renko chart. I will also be demonstrating the same using the Tradingview renko chart.
So, without much further ado, let’s dive into this advanced renko trading strategy.
Configuring the renko trading chart
To start with the obvious, we begin by configuring the renko trading chart. For this advanced renko trading system to work, we look at a EURUSD fixed renko chart. We make use of the 10 pip as the box size.
What this means is that when price closes up by 10 pips or if price closes down by 10 pips from the previous renko box, a new brick is drawn. Similarly, when price closes down or up by 20 pips, a reversal renko box is formed.
This should be simple enough for the readers. In this example, you can see the below chart. This is the EURUSD 10 Pip fixed renko chart. If interested, read about Tradingview renko chart configuration.
The base chart timeframe for this renko chart is the 15-minute time frame.
This means that price close occurs on the 15-minute chart timeframe. Read about base chart timeframe for renko.
Setting up the forex trading indicators
The next step in this renko trading strategy is to bring in the indicators. As mentioned earlier, we make use of three trading indicators. Let’s take a look at each of these indicators and understand their role in this renko strategy.
Moving Averages
We use two instances of the exponential moving averages. The first EMA uses a period of 10 while the second EMA uses a period of 20. Both the exponential moving averages derive their price from hl2 or the average of the high and low.
The two moving averages are important in visually showing you the trend when trading this renko strategy. Needless to say, when the shorter moving average EMA(10) is above or greater than the longer moving average EMA(20), price is bullish.
Likewise, when the shorter EMA(10) is below the longer EMA(20), price is bearish.
The slope of the longer EMA(20) shows the steadiness of the trend.
Relative Strength Index
The Relative strength index, as the name suggests showed the relative strength of the price. Depending on how high or low price close, the strength is determined.
You should use the RSI with a setting of 7 periods. The reason why I choose 7 is purely out of preference. But there is some logic behind this. Using a larger value makes the RSI less sensitive to price change. Choosing a smaller value makes it a bit too sensitive to price change.
I find the 7 period RSI (based on the fact that we are using a 10 pip fixed renko chart) to sit in the sweet spot for this trading strategy.
The role of the RSI indicator in this advanced renko trading strategy is to act as a divergence indicator. I will touch upon the concept of divergence briefly, later in this article.
Commodity Channel index histogram
The commodity channel index or the CCI is a relatively well known indicator. But for this advanced renko trading strategy, we use the histogram version. This way, the bars are easier to read. The same concept applies.
We have the overbought and oversold levels defined at +100 and -100.
The role of the commodity channel index histogram is that it acts as a trigger. When the CCI histogram rises above or below the +/- 100, it signals strong market momentum.
The general convention is that when the market is overbought or oversold, a correction is due to the opposite side. However, this blanket definition does not apply all the time. There are many instances when price continues to maintain the direction.
Traders have lost quite a bit of money by wrongly interpreting the overbought and oversold conditions.
As mentioned, the role of the CCI histogram indicator in this advanced renko trading strategy is to act as a trigger. i.e: when the conditions are met, and the CCI histogram is above or below +100 or -100 respectively, we act upon it.
Advanced Renko Trading System – The final chart set up
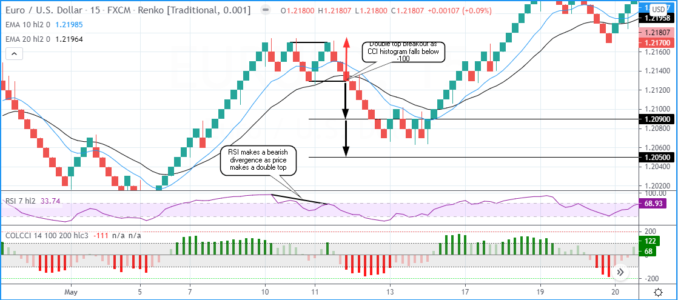
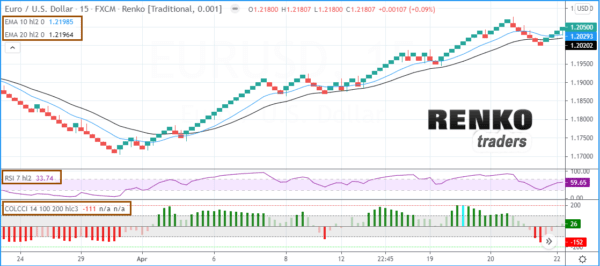
The below chart shows the final template after you have set up the renko charts and configured the indicators.
For those of you who are curious, or don’t know what CCI indicator to use, just go to the Tradingview indicator section. Search for cci histogram.
This will open up a bunch of indicators to choose from. In the resulting indicator window, select Colored CCI Histogram v2 by JustUncleL.

After having your charts set up, the next step is to look at how to trade of course. But as I said earlier, let’s take a detour to talk about divergence.
Overview about divergence in trading
The simplest definition for divergence in trading is when two comparable values do not move in sync. In other words, when price is making a lower low, comparing to a previous low, the other comparable value should also do the same.
In this case, the other comparable value is the RSI price itself. When you find that the RSI is instead making a higher low, or a lower high, this phenomenon is called divergence.
The concept of divergence originally comes from the Dow Theory, postulated by Charles Dow. In this description, Dow looks at the divergence between the Dow Jones industrial and the Dow Jones transportation index.
The Dow Jones index as we know today is quite different. But decades ago, the Dow Jones was truly made up of industrial companies. Transportation was a key element for this industrial companies to ship their goods.
So, when activity among the industrial manufacturers rose, you also expect the transportation activity to rise. When there was a mismatch, or a divergence, it meant that something was wrong.
There are a lot of topics covering divergence, so this article will not go into further detail. This one here gives a good explanation.
How does the EMA, RSI and CCI advanced renko trading strategy works?
The trading signals are taken based on the following:
- The trend
- The pattern
- The trigger
The trend is simply made up of looking at the two EMA’s. The trigger is also quite easy. When the CCI histogram moves above or below + or – minus, that is a trigger to pull the trade. It is the middle part, the pattern that is the most important.
Trade set up – Understanding the patterns & divergence
The chart pattern we talk about here is nothing fancy. It is the most basic of all. The double top and double bottom pattern.
The double top pattern forms when price fails to rise and close any higher than the previous higher close. Likewise, the double bottom pattern forms when price fails to fall any lower than the previous lower close that formed.
The general consensus is that when reverses after a double top or a double bottom, it will break the previous low or the previous high. When this happens, traders expect the price to move in that same direction.
The minimum movement after the breakout is equal to at the very least, the same distance where the double top or double bottom pattern formed.
The renko chart set up below shows a quick view of the double top and the double bottom pattern.
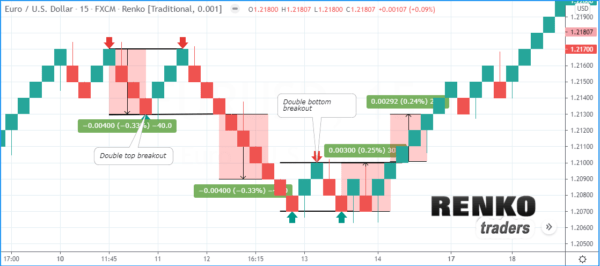
But you might say that you already know this. Well, here’s the catch! Not all double tops and not all double bottoms work as expected. Price can make a breakout, only to reverse and move back in the opposite direction.
This is known as a fake out.
In order to avoid this fake out, we utilize the RSI divergence concept.
When price makes a double top, the RSI indicator should show a divergence. Generally, a higher high and a lower high on the RSI. Likewise, when price makes a double bottom, the RSI should make a divergence, showing a higher low and a lower low.
Now, depending upon the trend, the divergence pattern can be either the regular divergence or the hidden divergence. Look for any of these divergences to form.
EMA, RSI and CCI histogram – Advanced Renko trading system signals
To take the trading signals from this advanced renko trading strategy, we should have:
- Trend – The trend should be aligned to the direction of the trade we will take
- The pattern – A double bottom pattern in an uptrend, or a double bottom pattern in a downtrend
- The moment – Identified by the CCI histogram moving above or below the +/- 100 level respectively
- The pattern breakout itself that happens during such moments.
The Long signal
In order to take a long signal, we should have the EMA’s signaling a bullish trend. The slope should play a role in determining the trade.
We should be able to see a double bottom pattern forming with a hidden divergence, or a double top pattern forming with a regular divergence.
Lastly, when the above conditions are met, look to the CCI histogram indicator. When the renko bar near the breakout line, the CCI histogram bar should be above +100. Upon this, place a pending long order near the breakout line.
Your stop loss will be the distance to the double bottom or double top pattern. Set the first position to close at a 1:1 risk reward limit and set a second position to a 1:2 risk reward limit.
The chart below illustrates a long position taken using this advanced renko trading strategy.
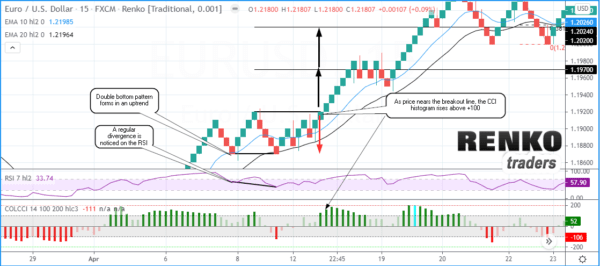
The order of analysis is as follows:
- Price is in an uptrend with both the EMA aligned to be bullish
- Price retraces, forming a double bottom pattern
- This double bottom pattern coincides with a regular divergence on the RSI
- Keep an eye on price as it nears the double bottom breakout line
- The CCI histogram closes above +100
- Go long with the two positions set to 1:1 and 1:2
The short signal
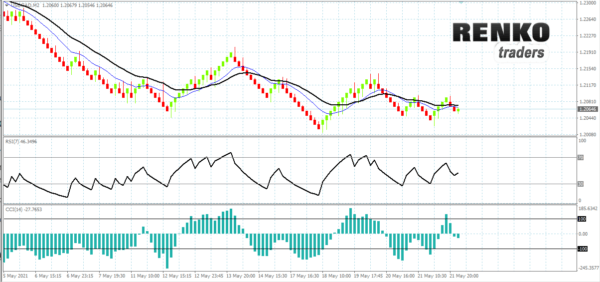
The short signal is exactly the opposite. But for this example, we will look at an instance when one of the trading conditions is still not valid.
First, take a look at the chart below for the short signal.

What you observe in this short signal is that the EMA’s are still bullish. But as you can see, the trade works out just fine. This is where some subjectivity is required.
You can of course wait for all conditions to be met. But this will mean that you will have very few trading opportunities.
EMA, CCI, RSI Advanced Renko trading strategy tips
Make sure that the distance between the two tops or the two bottoms are not too wide. For example, don’t trade on a double top pattern where the tops are separated by some 20 renko bars. But at the same time, do not trade the very short term double top.
This is when you have a double top or a double bottom pattern forming within just three renko bars. This can be risky for you.
What is the concept behind this advanced renko trading system?
The concept is quite simple, if you didn’t figure it out already.
We trade the corrections within the trend. While the exponential moving averages determine the trend, the double top and double bottom patterns are qualified based on divergence. Once you have this in place, gauge the price movement by looking at the CCI histogram indicator.
As the moment rises when price nears the breakout line, the greater the probability of that trade moving in the same direction.
But remember that this is not a fool-proof method. You will still come across losing trades from time to time. This is where your risk management comes into the picture. Do not let greed take over leading you to shun the risk management principles out of the window.
EMA, RSI, CCI Advanced renko trading system for MT4
You can download the MT4 template and the custom CCI Histogram indicator here. This is the MT4 renko template to help you get started. Below is how the indicator looks like on MT4.
Just remember that you will need to load the template on your offline renko chart. Get the MT4 renko chart indicator, if you haven’t already. Please support my efforts. Click share to unlock the zip file.
Download File: