When trading with Renko charts, be it using the Tradingview charting platform or the MT4 trading platform, the conventional wisdom dictates on using the M1 chart time frame as the base time frame to build offline Renko charts. However, you can also use other base time frames and not just stick to the M1 time frame data.
Many traders have often asked the question as to why for example I use a 15-minute Renko chart when many use only M1 time frame. In this article you will learn what it means by using the different base time frame data to get an idea on how the Renko charts are formed.
By the end of this article you should be able to use different base time frames on your own Renko chart analysis.
Before we begin, there are some terminologies that need to be cleared up.
What is the base chart or base time frame?
In specific reference to MT4 Renko charts, you basically need a chart time frame (usually M1). Once your drop your Renko building indicator or EA on this M1 chart you can then load up the offline chart.
On Tradingview, the process is pretty much the same, with the difference being that the Renko chart is populated automatically.
This M1 chart is what we call or refer to as the base chart.
Why use a base chart?
Renko charts are typically plotted using tick data. Tick data is a time independent chart (similar to Renko). One tick usually refers to 1 trade or a transaction. There are different versions of the tick chart. For example, some make use of a 300 tick chart, which means that after 300 trades, a new tick chart is plotted.
Bear in mind that M1, M5 and other time base charts are based on time and not on the tick or the trade.
Renko charts are traditionally plotted based on tick charts (1 tick) and can display the Renko blocks every time price closes “x” number of ticks.
The MT4 trading platform does not offer a standard tick chart, meaning that traders use the next best thing, which is the M1 chart time frame.
The basic flow is shown below:

By now it should be evident on the importance of the base chart from which the Renko charts are built. The next chart below shows a 1-minute base chart and the corresponding 10 pip offline Renko chart on MT4.

Now, if we switch the base chart from M1 to D1, you can obviously expect to see different data. The next chart shows the same 10 pip offline Renko chart but with daily close.
In the chart below you can see how the Renko chart bricks have changed slightly especially in terms of the wicks.

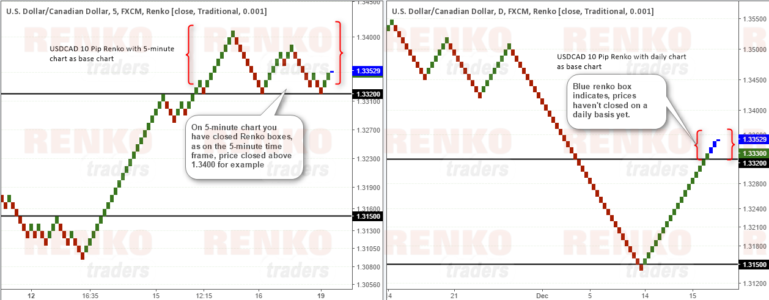
Now let’s take a look at Tradingview charts. The chart on the left shows a 5-minute base chart for Renko while the chart on the right uses a daily close. The Renko box size for the instrument is set to 10 pips for both.

The above chart shows how the base chart plays an important role. On the left side, you can see closed Renko boxes above 1.330 – 1.3400. This is because on the 5-minute chart, there are candles that closed above 1.3300 all the way through 1.3400. However, on the daily chart the Renko boxes are still blue (meaning that price hasn’t close above 1.3300 on the daily chart just as yet).
What does the different Renko base chart mean for trading?
Firstly, even before you ask, there is no right Renko base chart. Some prefer to use M1 data, while others prefer to use M15 or even H1. Think of the base chart as the chart time setting that you want to use. An M1 close is ideal for scalping, while a H1 or H4 close can be used to swing trade the Renko charts as it takes 60-minutes or 240-minutes for price to confirm a close above a certain level.
In most of the weekly Renko technical analysis that is posted on the website, a 10 pip Renko box is used either with a 5-minute or a 15-minute close. This simply infers that the closing prices are based on the 5-minute or 15-minute close which can show slightly different results, especially if you compare a 1-minute closing base chart for Renko to a daily closing base chart for Renko.
Let’s take a look again at a daily and 1-hour regular candlestick chart.

From the above you can see that while the daily chart on the left closed with a doji, meaning that price posted a high and low but closed nearly at the opening price, if you applied the Renko chart to the daily time frame, you would only see wicks (in MT4) and nothing at all on Tradingview’s Renko charts.
However, the 60-minute chart on the day shows that price closed at least 10 pips during the intra day which would show a couple of Renko bricks being formed.
So, a Renko trader using daily charts would have no Renko bricks, while the one using the 60-minute chart would see a few Renko bricks.
Questions on Renko time frame
Below are some questions received from other readers which I will respond here for the benefit of everyone else. You can also ask questions by commenting below.
May I ask you why you are not always using M1 as the feed for Renko charts like everyone else? You sometimes use H1 for example. Thanks.
The reason I use a different time frame is purely a matter of choice. You can build Renko charts based off M1, or you can also build Renko charts based off H1, H4 or any time frame of your choice. To put it another way, it is as simple as trading a regular M1 chart for scalping or trading a daily chart for swing trading.