A commonly asked question on the mean renko charts is how prices are plotted. There seems to be quite a bit of confusion in this regards due to the fact that the open and close look different to that of the standard renko chart. In this article, we explain how the mean renko chart works and how the prices are plotted.
In order to understand the structure of the mean renko chart, one needs to first understand how the standard renko chart. In a standard renko chart, a new brick is plotted when price moves ‘x’ number of pips from the previous close.
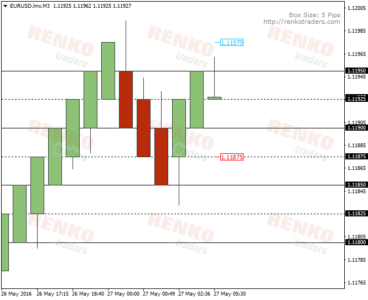
The chart below shows a EURUSD standard renko chart with 5 pips. On the chart you can also see the price levels plotted by the horizontal lines. Starting from the lowest at 1.1175, when prices move 5 pips higher to 1.118, a new renko brick is formed. Once price reaches 1.1195, you can see the bearish renko brick. For the reversal brick to form, price needs to fall ‘x’ times 2 times. In other words, a reversal at 1.1195 requires price to fall to 1.1185 or 10 pips. Read more on how to find the right renko box size to trade.

With the standard renko chart, it is rather easy to see as the bricks closely track the real closing prices on the chart.
Now when you look at the mean renko chart, which is also set to 5 pips, the way the mean renko bricks are plotted is different.
Unlike the standard renko chart where a new brick is plotted every time price moves 5 pips higher or lower, in the mean renko chart new bricks are plotted every time price moves 2.5 pips higher from the previous close.
Therefore, in a 5 pip move, while the standard renko chart plots one price, the mean renko chart plots two bricks (2.5 pips x 2). Or when it comes to a reversal, while the standard renko chart will plot a reversal brick when price moves 10 pips from the previous close, the mean renko chart will plot 4 bricks (2.5 pips x 4).
So the obvious question that comes to mind is, why is the mean Renko chart plotting new bars every time price moves 2.5 pips from the previous close when the brick size is 5?
Watch what happens when you plot the sub-levels (0.25), which explain the way prices are plotted on the mean Renko chart.

In the above chart, when we plot the sub levels, 1.11825, 1.11875, 1.11925 denoted by the dotted line you can now see the 5 pip brick size coming into play. You can see how new Mean Renko bricks are plotted with open at 1.11825 and closing at 1.11850 and so on. In the mean Renko brick, it is important to note that the sub levels are synthetic prices meaning, price may or may not have retraced 2.5 pips lower.
Standard Renko v/s Mean Renko bars price difference
Let’s look at this from another example, by means of using a 10 pip mean Renko bar to make it easier to understand.
Before you look at the chart, let’s figure out a few things. When price is moving steadily up or down, we know that a new standard renko brick is formed after every 10 pips move in price in the direction. So, if EURUSD was moving higher from 1.118 to 1.12 we have a 20 pip move which is nothing but 2 standard renko bricks (10 pip x 2).
Now what do you think how the Mean renko chart will plot this same move? Would it be a 2 mean renko bricks? Or would it be 4?
Let’s look at how the Mean renko now looks like for the same move from 1.118 to 1.12

The above chart illustrates the synthetic open/close on the Renko chart. The open on the next brick is automatically plotted at the mid-point of the previous price. But does it mean price retraced back 0.25 pips and then moved higher? The answer to this is yes and no. And the best comparison for this is probably, looking at Candlesticks and Heikin-Ashi candles where price is depicted differently.
The next chart below shows the regular candlestick and their corresponding Heikin Ashi candlestick. Notice how the open/high/low/close differ. While price actually opened at 95.20, the Heikin-Ashi open is at 95.16. Similarly the actual close depicted by the regular candlestick is at 95.28, but the Heikin-Ashi’s close is at 95.25

Mean Renko Bars – Is there always a pullback?
The first thing to remember is that in a Mean Renko chart, the open price is always synthetic. In other words, the open of the new Mean Renko brick is always plotted at the mid-point of the previous Mean Renko bar. This is what often makes traders confused as one can mistaken it to think that price actually pulled back on the next bar before closing higher.
The next chart below explains the pricing in the Mean Renko bar.

At 1.11584, prices indeed pulled back low and this is aptly depicted by the lower wick in the mean bar. But a few pips later, the open that you see at 1.1170 is a synthetic open, as you can see, after price moved above 1.1175, there was no pull back to 1.1170. The above shows that while Renko bricks make a synthetic open at the previous Mean Renko bar’s mid-point, there are moments when price does pull back.
From the above, there is one clear pattern that emerges, which is the wick on the Mean Renko bar. When you see the wicks, you can be sure that price indeed tested the high before closing back lower. On the other hand, a clean Mean Renko bar with no wicks mostly likely represents a synthetic open, but at the same time there are moments in the markets where prices do pull back before pushing higher.
A reader pointed out a question:
For example, if Brick 1 opened at 1.12614 and closed at 1.12814 (a 20 pip brick), then a new Mean Renko Brick is printed when price falls below 1.12714 and closes 20 pips lower (to 1.12514). The price point of 1.12714 forms the mean price (Open + Close/2) of the previous Renko brick.
But what if the market never pulls back to the midpoint of the previous bar’s open and close, as tends to happen on an intraday chart in a strong trend? Do you still force the new bar’s open to be halfway between the previous bar’s open and close, even if the market doesn’t trade to that price?
To answer this question, I will first remove the fractional pricing. Therefore, when a 20 pip brick opens at 1.1261 and closes at 1.1281, then a next bar automatically opens at 1.1271 (this is the mean or Open + Close/2 price level). From 1.1271, when price moves 20 pips higher, then the next bar closes at 1.1291. In other words, Brick 1 closes at 1.1281, Brick 2 will close at 1.1291 (10 pips higher from previous close but 20 pips higher from the mean price of the previous brick).
But what is the market never pulls back to the midpoint of the previous bar? Even then the next bar open is at 1.1271 (in this scenario it becomes a synthetic open).
But what if the market falls to 1.1262? Then Brick 2 will have the following structure.
Open: 1.1271, Close 1.1291, Low (lower wick) 1.1262.
If the market falls to 1.1251 or 10 pips lower from previous synthetic open that is plotted, then you get a reversal mean Renko bar.