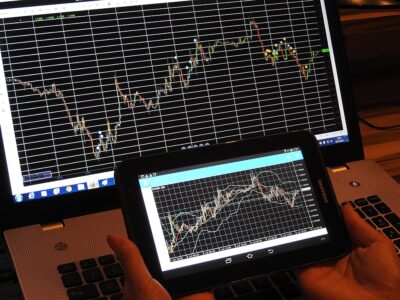
Just like any other chart that provides information to traders, Renko has its own specialty. Although the Japanese Candlestick may be more popularly seen on financial websites, Renko is a fledgling trend for those who are trading FOREX. A quick glance at several trading forums and you’ll see just how many people are now looking at Renko apart from Candlestick and other bar charts.
Renko charts in a nutshell
Just to be clear, Renko isn’t the magic answer that will clear up any confusion you have with other charts. It does, however, help traders gain a different perspective on price trends.
If you’ve been trading in the Forex market for a long time now, you might see a similarity between Heikin Ashi — a weighted version of candlesticks calculated with the close, high, low, and open formula — and Renko when it comes to presenting price trends.
But that’s where the similarity ends. Renko Charts are unique in the sense that they are built using price, unlike Heikin Ashi where time is an important factor. What’s great about traders that use Renko charts is the fact that due to the lack of noise in price bricks, it is easier to trade. And we all know the popular adage that “trend is your friend.”
Renko charts are used not only in the Forex market but also in other forms of investments such as Futures. For those who like to trade using price action, there is no better chart than Renko. That’s because from chart figures to resistance and support levels, you can clearly see everything that the price is doing.
Setting up Renko Charts for Forex
In order to setup a Renko chart for FOREX, people must begin with an underlying asset, for example JPY/USD, and then decide on a minimum price change that they want. If the underlying asset goes through a minimum price fluctuation, the trader will then put a price “brick” on a chart to indicate the change.
When creating a Renko chart, an investor will use hollow bricks for rising price movements, and solid bricks whenever the price falls. The bricks are always drawn at a 45-degree angle from each other.
To give you a better perspective on the bricks, the bottom-left corner of a hollow brick must touch the upper right corner of the previous brick. Conversely, the upper-left corner of a solid brick must tapoon the bottom right corner of the brick before it.
FXCM states that by following these price movements, traders can “identify noticeable gains and losses in the underlying assets that may signal a good time to buy or sell. If markets are relatively flat, the bricks will take some time to form. However, the bricks should form quickly if markets are moving rapidly.”
Use of Renko Charts
It is probably because of its presentation that Renko charts are now being used by traders who expect to make better trading decisions. That being said, Renko charts will not be able to help you unless you have a deep understanding of the concept of different market dynamics. Without this knowledge, no chart will be able to help you make sound decisions.
Now, the question is, why use a Renko Chart when there are plenty of other conventional charts to use?
A quick answer to that would be purely preference. For the wise technical analyst, Renko charts can offer a lot more information than Heikin Ashi. Renko can be extremely useful if you’re not worried about the time associated with the prices. Due to the nature of the charts, there is lot of key market data that can be easily seen but missed entirely when using other well known charts.
Reasons why you could use Renko Charts
Here are some good reasons to use Renko Charts…
Pull backs – Some trading guides discuss how to trade pull backs but in reality, this move can be quite difficult unless you are positive with your approach. By using Renko, the pull backs in a trend will be a lot easier to spot since they don’t require a lot of subjectivity.
A lot more trading opportunities – If you want to scalp the market or swing trade, Renko Charts will be able to show you several methods of trading. From taking profits every 20 ticks to countering the trends, the charts will be able to make things easier for you. This will all depend on the size of your Renko bricks.
Price uncertainty – In some bar type charts, the uncertainty of prices commonly refer to those that fluctuate back and forth. While this can also be seen on Renko Charts where you can see price range patterns with bricks being placed up and down, there is an obvious gain to using this data.
The benefit is that you will be able to see the indecision areas much better. If you have a good understanding of technical analysis, you will be able to see past through the price action and determine why the market is behaving as such. Read more about the Renko trading strategies for forex.
In short, if you are looking for an alternative way to check the price movements in the market, Renko Charts will be worth your time. As long as you have an open mind and willing to explore data, you will be able to see perspectives that only Renko can give you.

