There are different types of renko charts. Surprise? Well, if you are totally new to renko chart trading then it is ok. It is important for you as a trader to understand how the different renko chart types work.
Renko charts, despite their simplicity can be disastrous if a trader does not understand how renko charts work.
In the previous article, I mentioned how Renko charts can be configured based on the box size. In this article, I will show you how to read the Renko charts. By the end of the article, you will learn how the Renko boxes are plotted on the chart, regardless of the charting or trading platform that you use.
Types of Renko Charts
There are two primary ways how Renko charts are plotted. Let’s explore these two types of Renko charts and see how the Renko chart is plotted differently.
- Period Close
- Price movement
The table below shows a summary of differences between the two types:
| Period Close | Price Movement |
| Plots Renko box based on closing price of the period (H1, H4, D1) | Plots Renko box based on price movement |
| More suitable for long term trade and technical analysis | Best works with short term markets |
| Indicator based trading shows considerable lag | Indicator based trading is more suited |
| Similar to swing trading | Similar to scalping |
Period Close – Renko Charts
The period close type of Renko chart is considered to be the more traditional approach to plotting Renko charts. In this type, a Renko box is plotted based on the closing price of a period that you select. The most common period selected is the Daily chart, but it can also be configured to a H4 or H1 closing prices as well.
The irony here is that despite the fact that Renko charts are not time dependent, the closing prices are. However, in ranging markets when price fails to close “x” pips to print a new Renko box, traders will find the difference.
The best way to illustrate the Period Close type of Renko chart is with an example.
The following chart below from Tradingview.com plots the Renko boxes based on the daily close (it can also be configured to H4 or H1 close as well, but requires a subscription).
The chart below shows the EURCAD Renko Chart, configured to a 50 pip close. The Renko box of interest is the one marked with an open/close of 1.41299 and 1.40799.
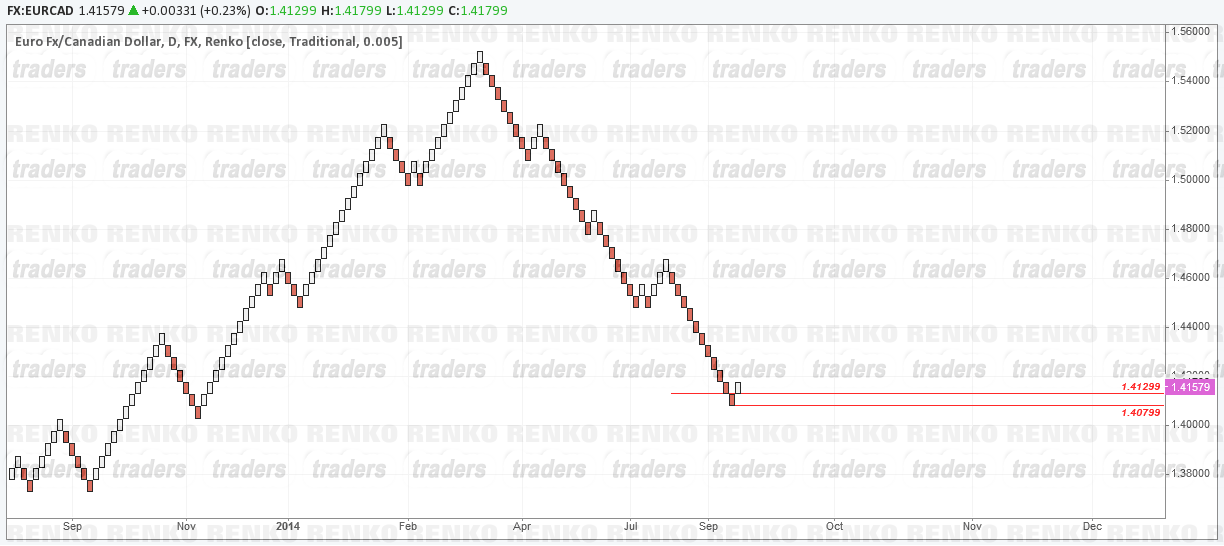
If we compare this price level with a traditional candlestick chart, we can see how the Renko chart is plotting prices.
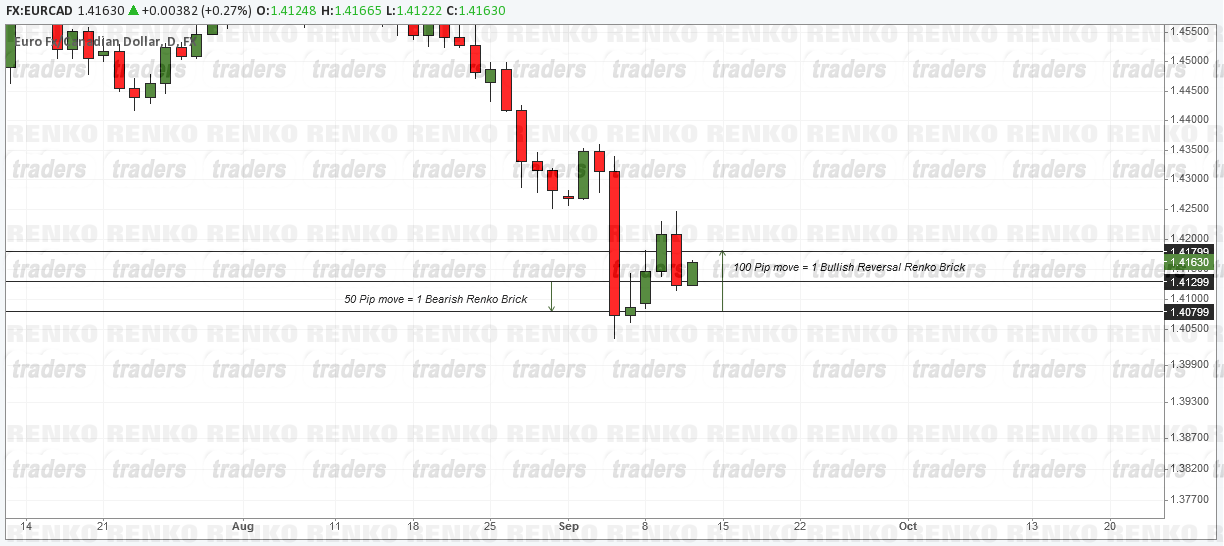
Here, we notice that the bearish Renko bar was plotted after the bearish long candlestick closed below 1.40799. The second candle with a small body closed back above 1.40799. The high was almost the same 50 pip move, but the Renko chart did not plot a new bullish Renko brick as we would need a 100 pip move to plot the reversal brick on Renko charts.
Despite the fact that price reversed again below 1.41299, there was no new Renko brick formed.
Price Movement – Renko Charts
In this type of Renko charting, Renko charts are not dependent on closing prices but rather on the price move itself. For example, for every 50 pip move, a new Renko brick is plotted. And this is regardless of the closing price. This method of Renko charting gives rise to many Renko bricks and is more dynamic in nature as it is calculated on price movements rather than closing price.
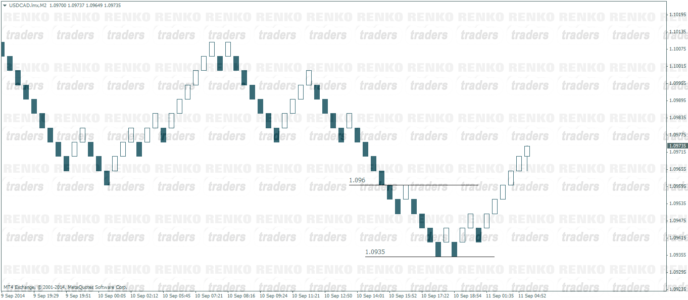
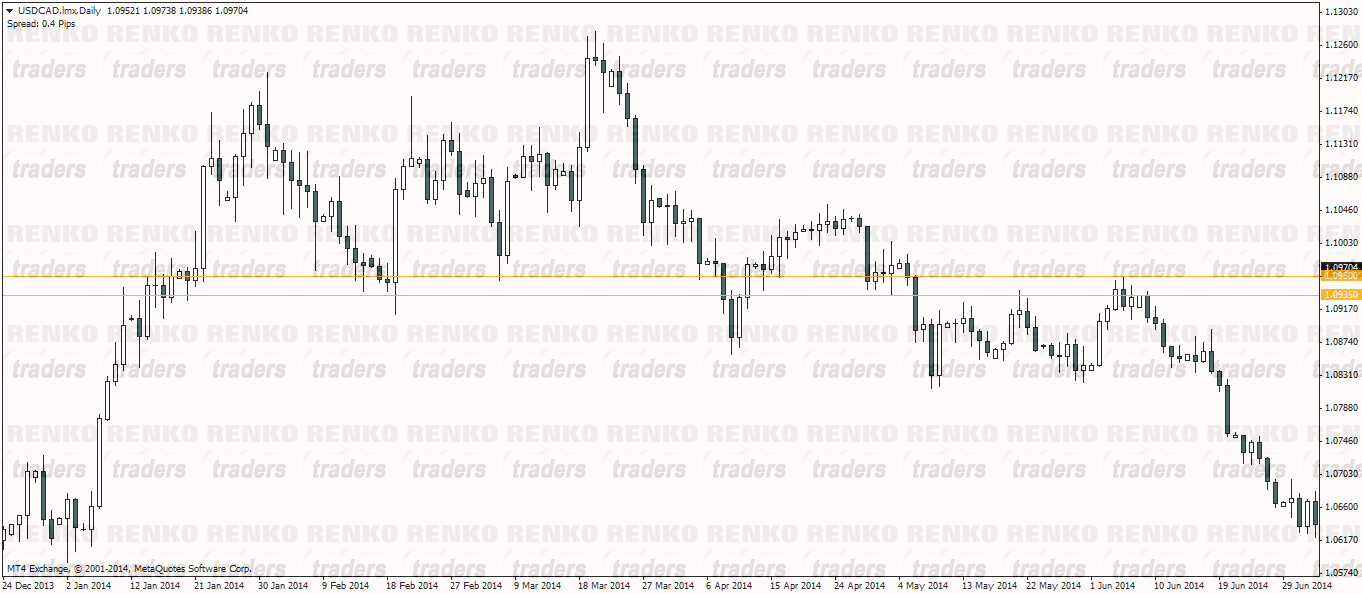
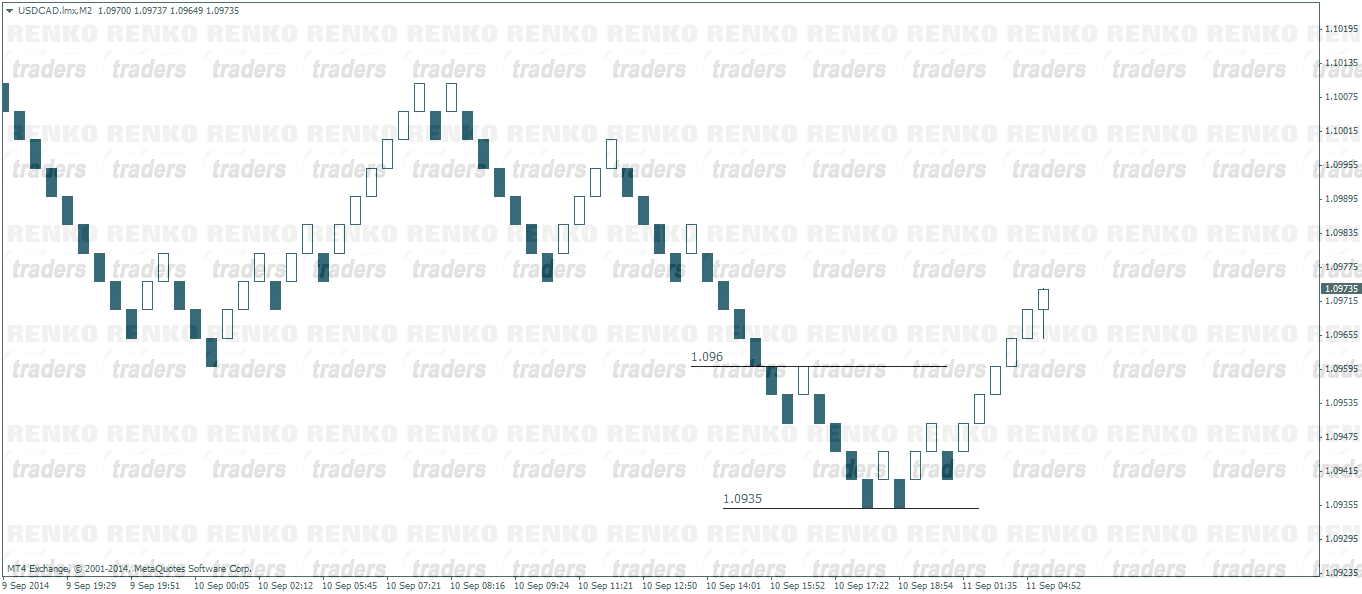
The chart below shows the regular candlestick chart (daily) for USDCAD. The two price levels of interest are 1.096 and 1.0935. Notice how price has been mostly ranging in the traditional chart.
The next chart below shows the USDCAD 5pip Renko box. Here, we notice how the Renko bricks have been plotted, every time price moved back and forth 5 pips within the 25 pip range.
A good example of the price movement and period close is to read about using the base timeframe chart in Renko. This is especially true if you are using the Renko chart on MT4 or a Tradingview Renko chart.
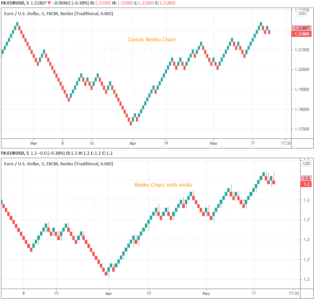
Types of Renko Charts – Standard and with wicks
Besides the above, Renko chart types are also called standard or with wick. As the name suggests, a standard renko chart is just the renko brick that you see. The box forms when price moves a certain number of pips. Similarly, a reversal renko brick forms when price moves twice as much in the opposite direction.
While the standard renko chart is still around to this day, popular demand gave rise to the renko chart with wick. Here, as the name suggests, you simply have the renko chart with wicks or tails. Similar to the wicks in candlestick charts, the renko tails show the high and low. These levels represent how high or low price moved, but failed to close to form a renko box or brick.
The below renko chart shows the visual difference between the standard renko chart and the custom renko chart with wicks.
The above two types of course still fall under the regular renko chart. But then, we also have the median renko or the mean renko. Although this chart type belongs to the renko chart family, it is different. Read how mean renko charts work. The article gives you a detailed view into why renko mean bars are so different. Based on this, your renko trading strategy can also be totally different.
Renko Charting Types – Does it really matter?
Yes, it actually does. The price movement based Renko charts plot differently compared to a period close type of Renko chart plotting.
This means technical analysis and especially indicator based Renko trading systems will differ vastly with the above two types of Renko charting.
However, the differences between these two types of Renko charts do mean that traders can scalp the markets. Obvious from the differences, the price movement type of Renko charts can be used for scalping purposes, whereas the period close type of Renko charts is somewhat akin to trading based of daily closing price for example, ideally suited for swing traders.
It is unfortunate that most traders who claim to trade with Renko charts fail to recognize this simple yet trade altering truth about Renko charts.
The next time you open your Renko charts, spare a few minutes to figure out how your charting or trading platform is calculating the Renko boxes which would help in approaching the markets accordingly.