Stockcharts.com is a web based free charting platform that offers traders and technical analyst’s access to different type of technical analysis indicators. Stockcharts is one of the oldest available charting platforms having been established in 1999.
Stockcharts.com has some very famous members behind the website including John J. Murphy, the renowned author of the “Technical Analysis of the Financial markets” book who is the chief technical analyst at Stockcharts.com
Traders can make use of the Stockcharts.com website without having to register but of course, this comes with some limitations such as not being able to save your charts or download the charts. As far as Renko charts are concerned, Stockcharts allows you to make use of Renko charts, besides other time independent chart types such as point and figure charts.
In this review of Stockcharts, we take a look at the Renko chart functionality offered which should help you in making an informed decision on whether it is ideal to use the Renko chart features offered by Stockcharts.com
Stockcharts.com – Using Renko Charts

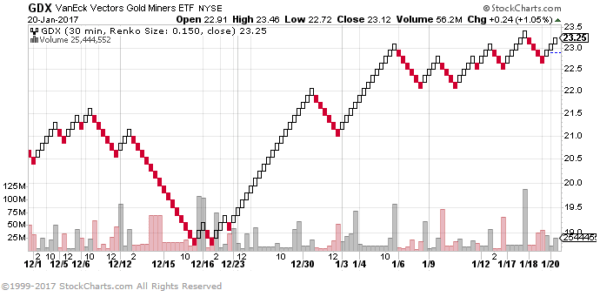
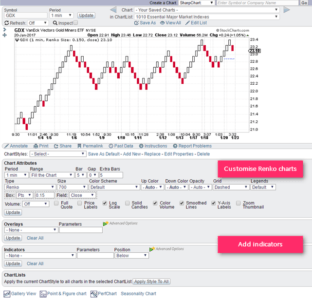
To use Renko charts with Stockcharts.com you can simply start off by first entering the ticker or symbol next to ‘SharpChart’. Once done, you can select the chart type in the chart configuration setting to ‘Renko’ and then proceed to make several adjustments or customization that you need.
In terms of customization, you can select intraday charts as well going down to as low as 1-minute chart. Note that when you select the base chart or the time frame as 1-minute, the Renko bricks are formed based on the time frame’s closing prices, which in this case happen to be the 1-minute charts. You can also set the ‘Refresh’ to 15-seconds in order for the chart to be updated based on the refresh frequency.

Stockcharts.com – Renko Chart Annotations
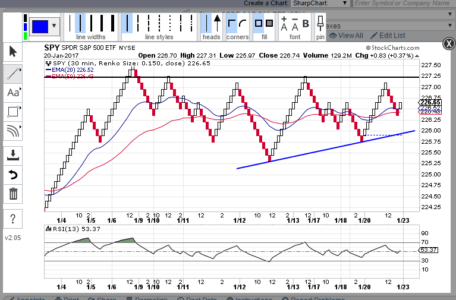
Stockcharts.com offers a fairly decent set of tools for chart drawings and annotations including the standard horizontal, vertical and trend line tools as well as standard drawings such as the Andrews Pitchfork, Fibonacci extension and retracement tools among other things.
What’s missing with the drawing tools however is the snap to OHLC which could have been a great way to make use of the drawing tools. It is surprising that this feature is missing when it is a standard on many different charting tools and platforms.

Stockchart.com Pricing
Stockcharts.com offers a fairly standard pricing which can be scaled based on your requirements. The most basic service starts at a price of $14.95 on a monthly basis, with discounts offered on a 3 months, 6 month and 12 month bulk subscription payment options. The standard deal includes free BATS data with some additional services such as John Muprhy’s market message newslettter and few other features. For more professional traders, you can pay more to get real time NYSE or other exchange data.
What’s good about Stockcharts is that no matter what level of service you choose, you can always have access to the Renko charts.
Drawbacks of Stockcharts
After taking a look at the Renko charts from Stockcharts.com I have to say that the service is very very specific. For example if you are a hardcore stocks trader, then Stockchart.com is the best product for you as you can build custom intraday Renko charts based on the U.S. stocks of your choice. However, that’s where the flexibility ends. For example, if you were trading forex, then Stockcharts doesn’t allow you to build intraday Renko charts and the same goes with the futures markets as well, making it a bit limited in terms of the markets that you can use for the Renko charts.
Still, Stockcharts.com does offer a fairly good product in the Renko charts that they offer and as mentioned this is something that equity traders will love especially if Renko charts is something that you like.

