
Thinkorswim (TOS) is an electronic trading platform that allows you to trade forex, futures, ETF’s and options. The Thinkorswim trading platform itself is free to use. But you will of course need to open account with TD Ameritrade in order to trade the financial markets.
This review of Thinkorswim looks into the charting capabilities using Renko charts. As you know, Renko chart is unique due to the lack of time as a factor.
Over the years, I realize, that when it comes to the native support of Renko bricks, many trading platforms fall short. This leads to either making use of custom indicators or making do with whatever capability is available.
This renko thinkorswim review will focus on two aspects:
- Native Renko
- Renko Indicators for Thinkorswim
The trading platform already offers native renko bar capability. Besides this, there are a few other Renko TOS indicators floating around.
How to use Thinkorswim renko charts?
Using Thinkorswim renko bars is very simple as there is support for native Renko charts. You can choose between a fixed renko brick or ATR. To use the native renko bar TOS settings, open a new chart. Head over to the settings and select the Time axis tab. Change Aggregation type to Range and select the Price Range.
You can read below for a more detailed step by step guide to use Thinkorswim renko charts. As mentioned, there are two choices for traders. You can choose between the fixed brick size or the ATR version.
As you know, there is a significant difference between using a fixed brick size and ATR.
How to create fixed brick renko charts on TOS?
Click on the charts tab to open this module. From here, you can click on the input field to the top left corner of your Thinkorswim chart.
Select an instrument you want to use. In this example we use AUD/CAD currency pair.
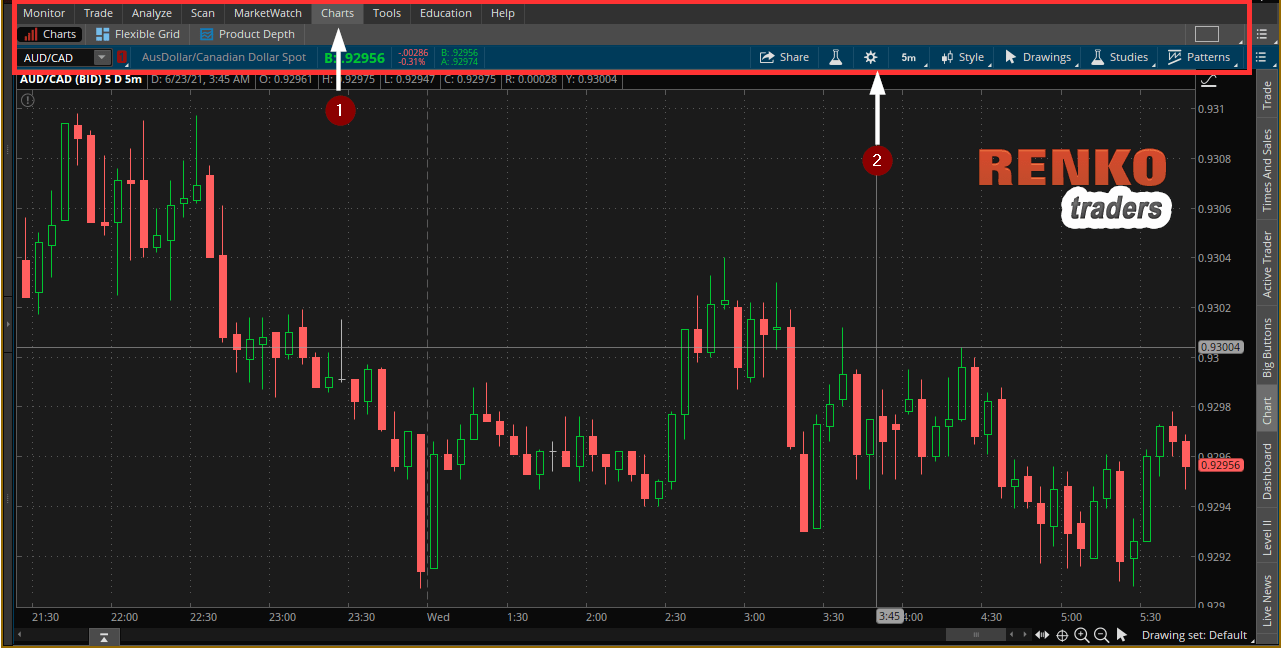
This will load your default chart settings. As you can see in the below picture, we have the standard candlestick charts loaded.
The next step is to convert this regular chart into renko bars. To do this, click on the widget icon which opens up a new window.
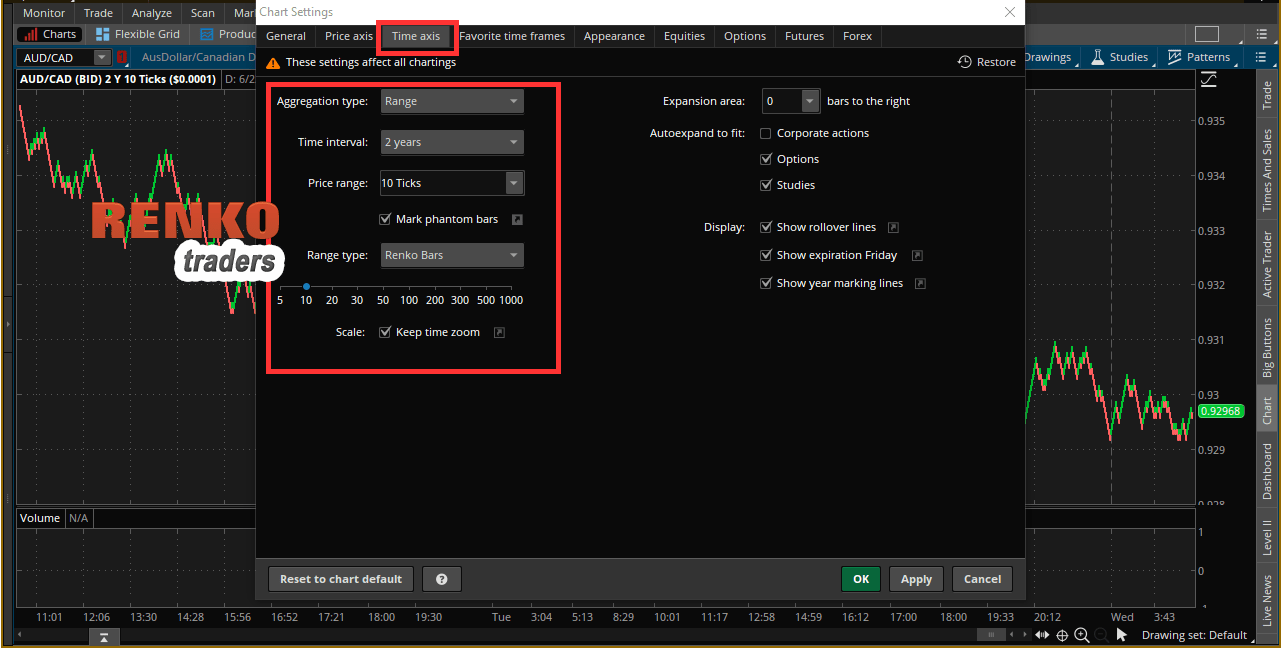
Make sure to click on the Time axis setting where you can configure the Thinkorswim renko candles.
Change the Aggregation type to Range followed by changing the Time interval to 2 years (or any period of your choice). The Time interval shows the amount of history to use when building the renko bars in Thinkorswim.
Under the Price Range, you can select the number of ticks. The amount of ticks you select will depending on the instrument.
You can also select custom ticks instead of using the default values. To use custom ticks like 12 or 35, etc click in the box next to price range and input a tick value of your choice.
In our example of AUD/CAD (which uses 4 decimals), we are using a setting of 10 ticks, which means a renko brick size of 10 pips. In the next chart below you can see the renko bars for AUD/CAD in Thinkorswim.
When you hover over the Renko candles, you can also see the brick size and the open/close used for the Renko brick.

How to create renko charts in Thinkorswim with ATR?
The ATR or the Average True Range setting is another common way to set up the Renko brick size. To do this, instead of choosing the tick size, you select ATR.
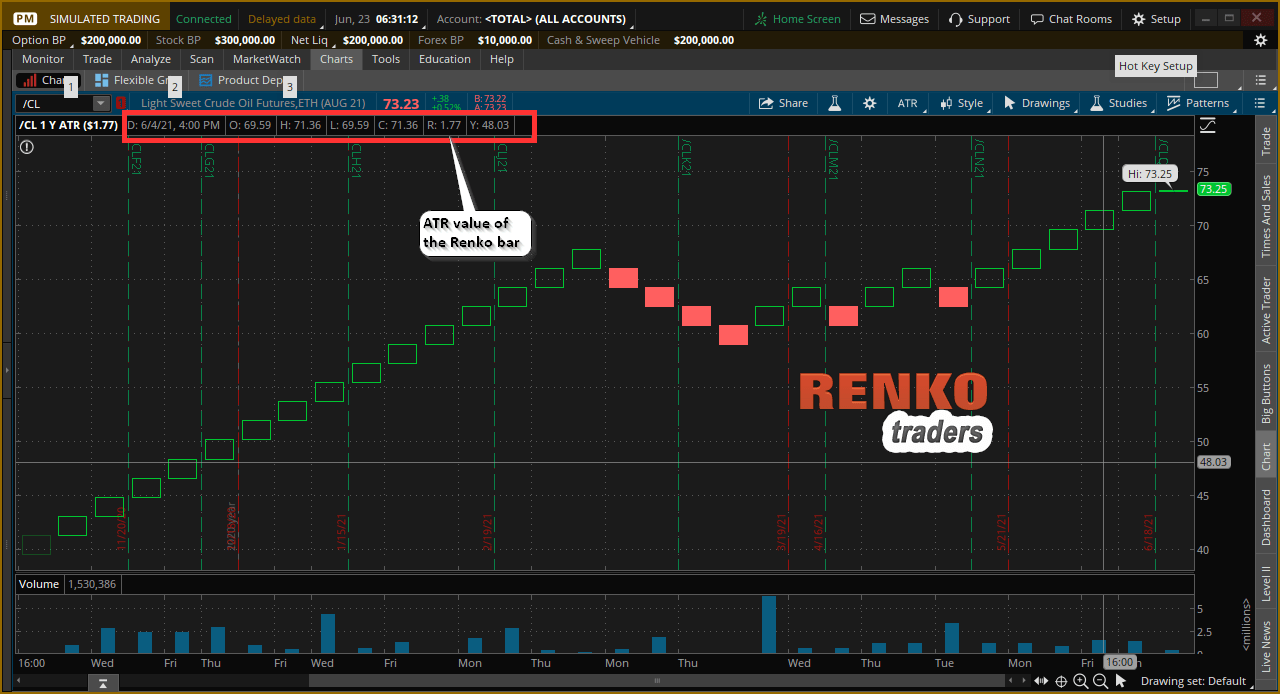
Similar to the previous method, you can look at the chart to see what the ATR value is.
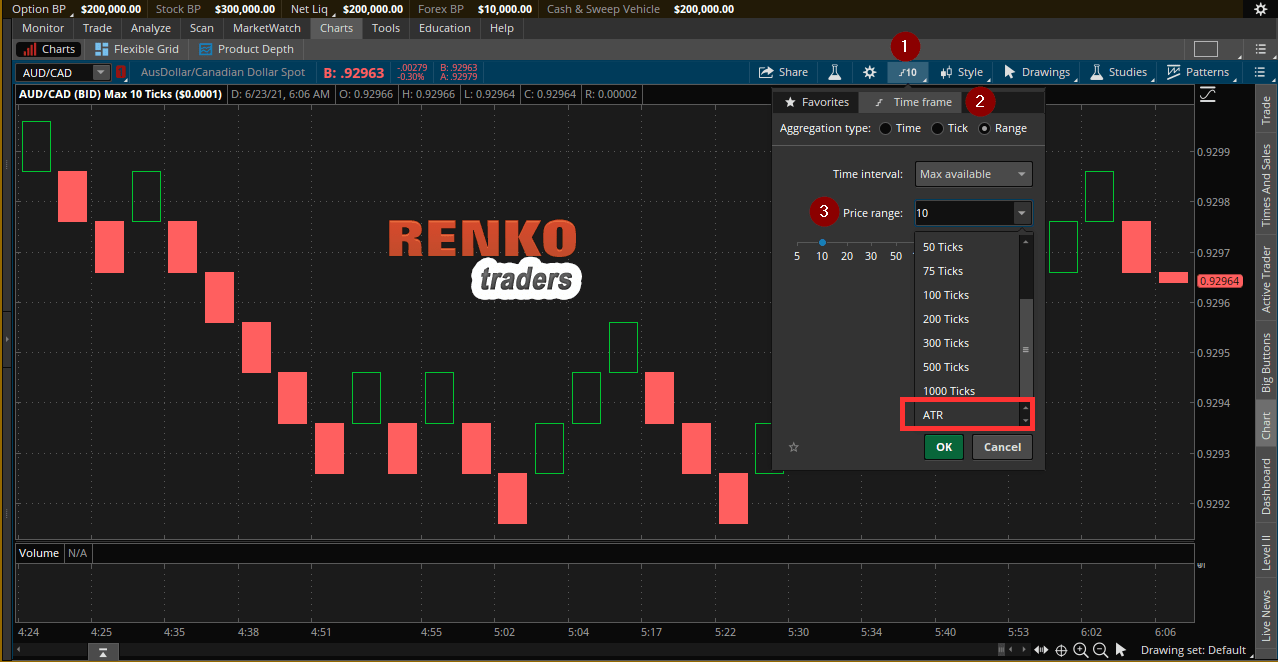
In this example of Crude oil futures, we see that the ATR uses a setting of 1.77.
It is up to you to choose whether you want to use ATR or a Fixed renko box size.
What ATR value to use for renko Thinkorswim?
If you are experimenting with the ATR value on Thinkorswim renko, then you may wonder what value it is. To be honest, it took me a while to figure it out.
In the below chart, we have an ATR Renko brick with the time frame set to 1 day. Based on this, I could see that the ATR value was 0.04. Since there wasn’t much to compare with, I had to manually look into the candlestick charts to get an idea.
Finally, I came upon the 1-minute candlestick chart with a 14 period ATR setting. This was as close as it gets. Look at the chart below to compare the Renko bar settings.

Plotting the indicators on the Thinkorswim renko chart is also simple. But note that not all of the indicators available in the trading platform will work.
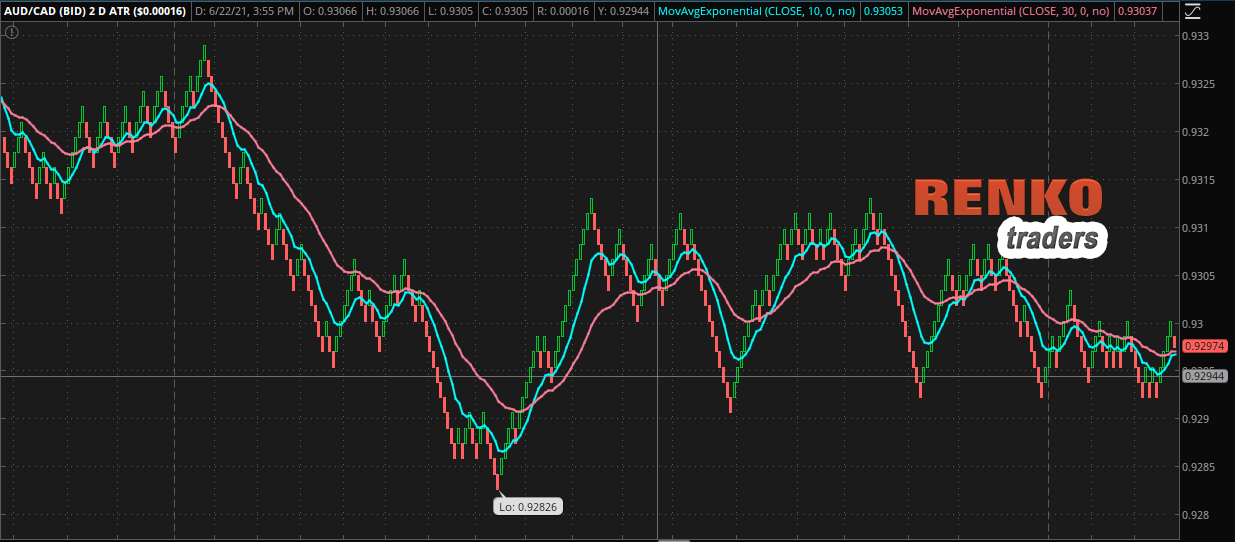
Below is an example of using the moving averages on the AUD/CAD renko price chart in the Thinkorswim platform.
How Thinkorswim calculates ATR for Renko?
When using Thinkorswim renko with ATR, the current day bars are completely excluded from the ATR calculation. Thinkorswim uses the Central Standard Time as the cut off for the day’s session.
When you adjust the chart’s time interval, the ATR also changes accordingly.
As per the documentation, if the time interval you are using is less than or equal to nine days, then the ATR value is calculated over the last seven days using the 1-minute chart time frame.
On the other hand, if the time interval is less than or equal to 150 days, then the ATR uses the 1-hour base time frame to calculate the ATR value.
For time frame greater than 150 days, Thinkorswim applies the 14-day ATR based on the daily timeframe.
I should however mention that even when you use a fixed brick size, TOS renko chart uses the same approach as with ATR.
Are the renko bars on Thinkorswim good for trading?
As far as the native support for renko bars, Thinkorswim does a fairly decent job, but leaves a lot to be desired.
But as obvious, few things are missing such as the ability to view the tails or the wicks from the renko candles. The ATR issue is also a bit murky. For example, if you want to use a Renko chart with an ATR setting of 14 period from H1 time frame, it is not that straight forward.
So if you are looking to use TOS Renko as a load and trade kind of platform, you will be disappointed.
In terms of the ease of use, it will take a while for new traders to get familiar with the Thinkorswim trading platform.
It would help to make the Renko settings a bit simpler to understand. With the current set up, traders will need to play with the settings until they get the hang of it.
But overall, Thinkorswim certainly has a good prospect of the native renko chart capability. But the functionality greatly limits what you can do with renko bars. You can of course build your own Thinkorswim renko indicator with additional customizations if need be.