The CADCHF currency pair at the moment looks to offer a long term trade opportunity with the potential to move close to 350 pips in the longer term horizon. However, before one gets excited at the prospects, it is important to understand the time frame or horizon for this trade set up could take months, if not a few quarters on average. But with good positioning and multiple orders being placed, traders could book partial profits at regular intervals. The eventual goal of this CADCHF trade set up is to ensure that the final target level we aim for trades risk free.
CADCHF Renko Analysis
100 Pip Box Size: We start our initial analysis by focusing on the 100 pip fixed box size. The first chart below exhibits, what I believe to be a falling wedge pattern. To further seek clarity, I also marked the pattern with the various alternating contact points. As can be seen, the initial high or point 1 was made near 1.10913, following which prices declined to hit a low at 0.73913 making it point 2. Prices then rallied towards point 3 near 0.97913. This level also marks a 61.8% Fib level retracement to the previous down leg.
After making a lower high at 3, CADCHF then declined lower, taking out the previous low at point 2, to mark the point 4 of the descending wedge pattern near 0.69913.
We now expect a rally to mark point 5, which should ideally make a lower high compared to points 1 and 3.
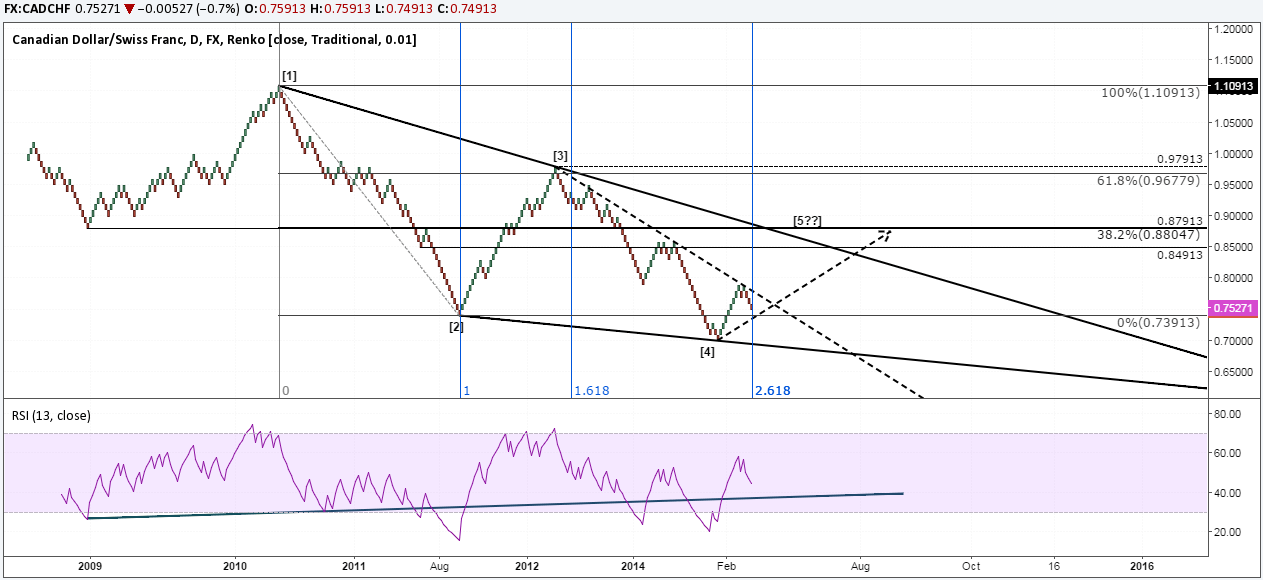
The possibility for point 5 comes in at 38.2% Fib level at 0.88047. This level is also a strong support and resistance level in the past and in fact we get a complete support/resistance zone between 0.87913 through 0.84913
By plotting a medium term falling trend line connecting the lower highs from point 3, we notice that most recently, price action rallied up to the trend line, formed a minor double top within 3 Renko bars and then declined.
By adding the Fib time zone tool, we notice an interesting observation. Between zones 0 – 1, CADCHF was in a downtrend, following which, from zone 1 – 1.618, prices were in a corrective rally. We then notice that after 1.618 zone, prices continued to fall right through the 2.618 Fib time zone level. In this view, we expect that a rally might ensue anytime from now onwards.
Last but not the least, in the above chart, plotting the RSI we also notice a potential divergence based set up especially between the low at 0.87913. I am led to believe that the 38.2% Fib level + the support/resistance + the divergence target combined with the Fib time zones all point to a rally towards 0.805 region (rounded off)
50 Pip Box Size: Now, when we look at a 50 Pip Renko box chart for CADCHF, we notice a potential bottom being formed based on the double divergence set up. Price makes a new low while the RSI prints a higher low. After printing the new low near 0.69913, CADCHF saw a strong rally with little to no pullbacks and hit the previous support at 0.78413. Here, price formed a double top and started its decline. The double top is also confirmed by a minor lower high in the RSI and the measured move of this double top pattern targets 0.73913. Combining the double top’s target and the previous resistance, we get a potential support zone near 0.73913 – 0.73413 and this is where we look for potential long trades.
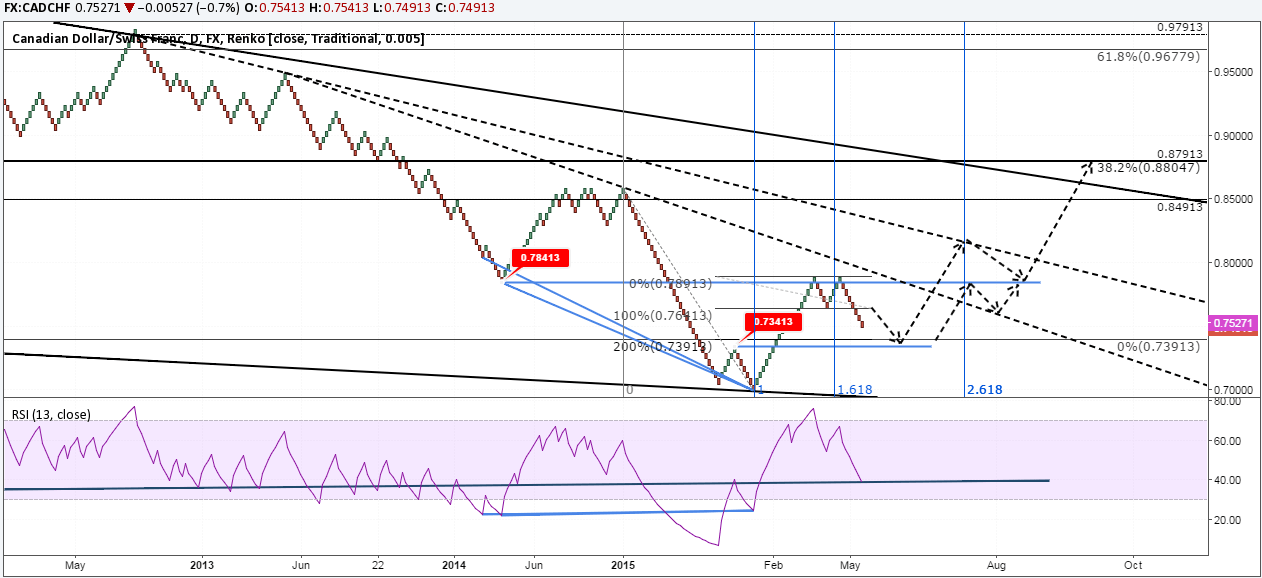
Once again, plotting the Fib time zone tool, we are in the declining leg of the phase. Therefore, while 0.73665 (rounded off) looks as a possible price level to go long from, we need to pay attention to the timing factor as well. Not shown on chart, is the time period estimates which point to a possible exit from the current declining leg for a period of 96 days. So far, we have completed 50 days into this decline phase, leaving us with another 46 days.
Focusing on 0.73665 level as a potential long entry, we are looking for a few markers in this region.
- We expect the RSI to form a higher low (near 0.73665), in comparison to the low at 0.69913
- We expect the RSI to form a higher low (near 0.73665) in comparison to the low at 0.78413 and even 0.80413
The arrows on the chart point to the two possible price action movements in the CADCHF currency pair.
Assuming that all goes to plan, we are looking at the target zone of 0.88047 or rounded off to 0.88 by focusing on the analysis from the 50 pip Renko chart.
On the longer term horizon, the CADCHF 100 Pip Renko chart, we are aiming for a move towards the 61.8% target zone of 0.9675, which could happen, should prices bounce off the 38.1% Fib to establish support there.
Ideally, while targeting the second move to the upside, we ensure that the position is trading risk free.
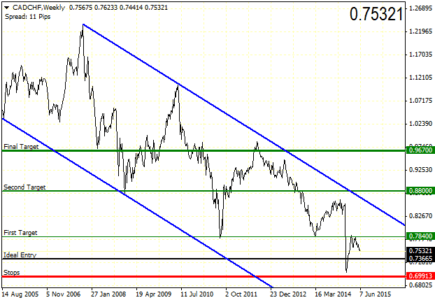
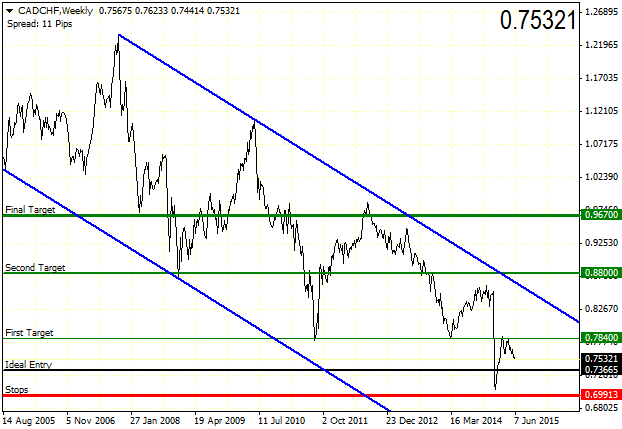
Explaining the above in terms of the simple line chart, the picture below illustrates the three target levels, the entry and the stop loss for the trade as well. The above chart should help provider traders with a clearer understanding of this analysis and can also apply their own technical analysis to the CADCHF chart.
CADCHF Summary
To summarize the above analysis, we look to the following aspects.
- The 100 Pip Renko chart forms the focus of the longer term objective towards the 61.8% Fib level at 0.88 as the final target
- The 50 Pip Renko chart allows us to not only time the entry but also find the ideal entry position, which we have currently identified to be at 0.73665
- There are two price targets we are looking at. The first target comes in at previous support that could turn to resistance at 0.784, the second target at 0.88047, the 38.% Fib level and the final target at 0.967