FTSE100 CFD
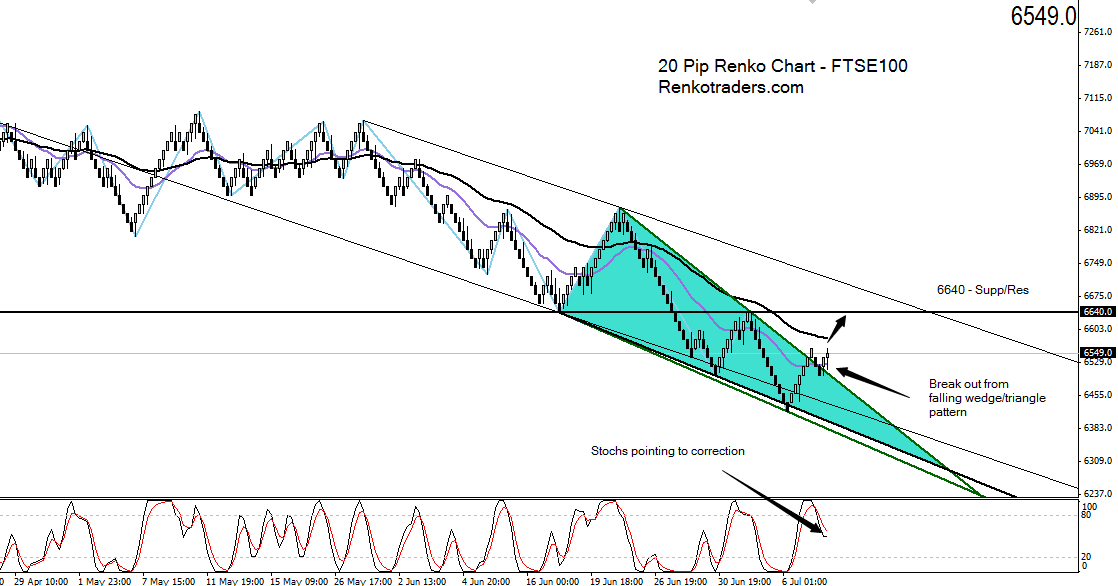
The FTSE100 has been volatile as with most of the markets today. Looking to the 20 point Renko chart, price is trading sharply in a falling wedge pattern that has formed inside a falling price channel. Support/Resistance to the upside comes ina t 6640, while the pattern itself could be invalidate should price make a new low below 6420.
Stochastics also point to a corrective move, validating (for now) a leg up to 6640.
Comparing to the GBPUSD charts, there is also a confluence as the Cable is expected to decline to 1.54 levels in the near term, thus giving potential bias to a rally in the FTSE Index.
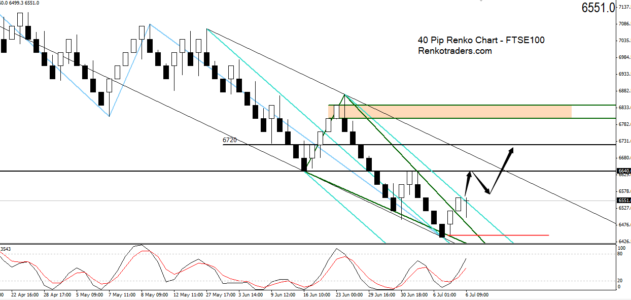
On the 40 point FTSE Renko chart, we have the same pattern playing out with price breaking to the upside from the falling triangle pattern. On the 40 point FTSE Renko chart, plotting the median line also shows a possible rally to 6640, which is the first resistance to the upside. Expecting a rally to 6640 and then a decline to build the bullish momentum with an eventual target to 6720.

Analysis remains invalidated should FTSE drop below 6443.1
To the upside, there is a lot of potential. 6640 is a level to watch for. If this resistance turns to support (and is tested from above), then the FTSE100 index could see further gains in store, with 6720 and eventually rally to 6800 – 6840 region.