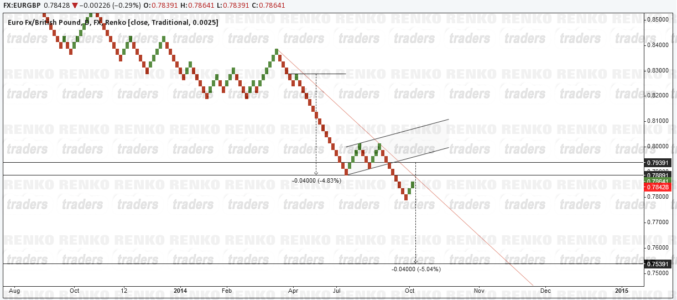
EURGBP Renko chart below is of the 25pip fixed box Renko. The chart shows a bearish flag pattern that was formed, with price breaking below the flag pattern. The bearish flag was further confirmed by a double top pattern that was formed, indicative of a drop to the downside.
While price did manage to break the bearish flag, it was done so without any retracements. Furthermore, price also cleared the main support level at 0.78891. The current rally with the bullish Renko bricks points me to the direction of a rally that could stall and reverse near 0.78891.
One of the reasons that 0.78890 stands out is that down trend line plotted. It shows a good confluence with the .7889 level. Of course, the risk here a break out of this trend line which could shift the bias to the upside, probably to test the double bottom low at 0.7914.

To the downside, a successful reversal near 0.7889 or even 0.7914 could see a conservative target to 0.7529 levels. I call it conservative as it is a measured target of the bearish flag, from the point there was a small term reversal.
Trading the EURGBP, I’d prefer to place a small position at 0.7889 followed by another short order at 0.7914 with stops for both coming in at 0.80141, targeting 0.7539 lows.