The British Pound showed us a glimpse of what uncertainty means and also indicates the potential of a Brexit from the EU. While a lot remains to be asked, such as what would Britain do if indeed it did leave the EU and the following negotiations including trade and EU migration, the technical chart for GBPUSD paints a very bearish scenario in the long term period.
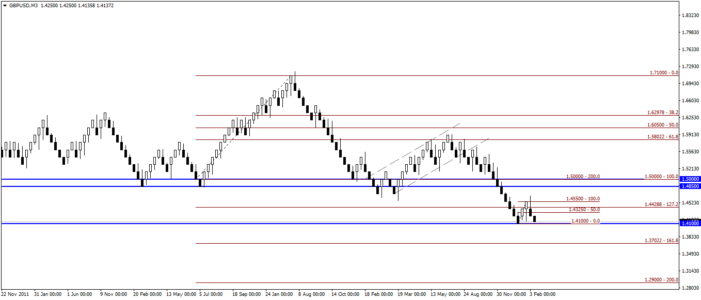
The 150 Pip Renko chart for GBPUSD shown below shows the key price levels in question.

First off, the recent bounce off 1.41 failed as prices quickly turned bearish. The current leg of bearish momentum should see GBPUSD decline back to retest the 1.41 where a potential support level can be formed. If 1.41 does indeed manage to hold the declines, a move to the upside could see prices test 1.48 – 1.50 level, which will be tested for resistance following a break of support.
The chart pattern also shows an inverted cup and handle pattern with the handle terminating on the pullback from 1.50 – 1.48 to close to 38.2% of the previous rally.
For now, the onus is on 1.41 in GBPUSD which will also mark a quick double bottom near the current lows. A successive rally off 1.41 could see an upside target to 1.50, coinciding with a retest to the broken support for resistance.
In the long term, the downside target for GBPUSD comes in at 1.29, marking the price move from the inverted cup and handle pattern, with 1.37 marking the 161.8% measured move of the declines.
The timing of the GBPUSD move to 1.37 or 1.29 will be important. Considering that the declines come before the June 23rd referendum, there is a strong chance that prices will bounce back higher, preferably breaking above the 1.50 resistance level. However, if the downside targets are not reached before the referendum is held, there is a very strong likelihood that GBPUSD could be in for some hard times.
EURGBP – A mixed bag
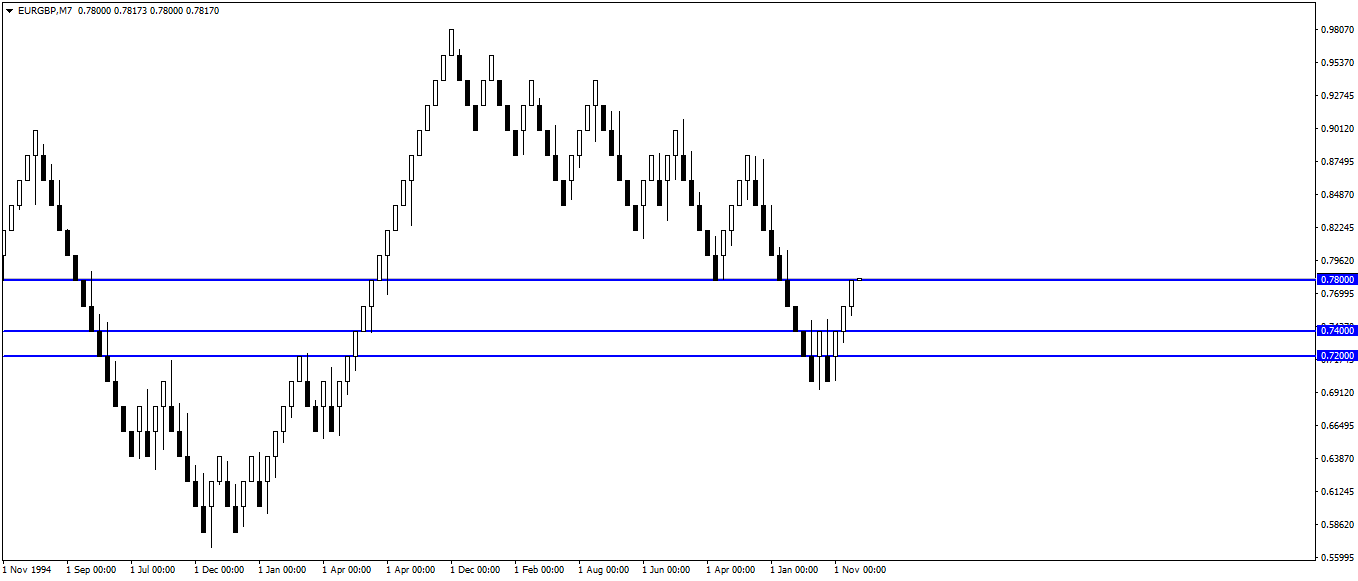
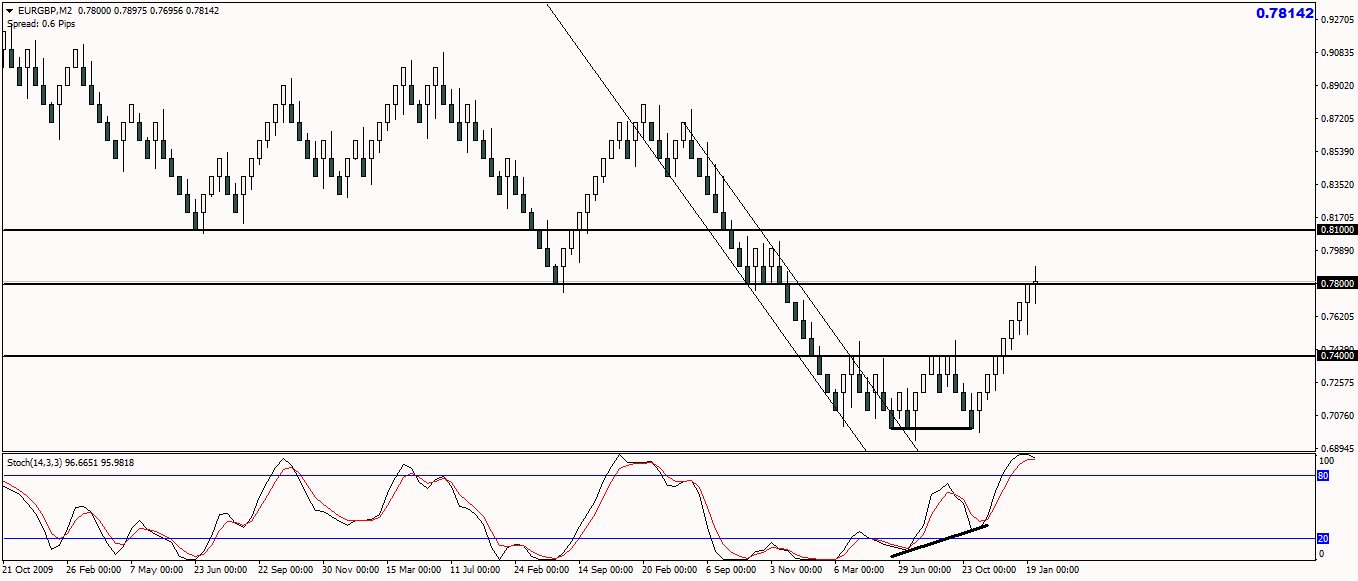
For EURGBP, following the double bottom near 0.70 on the 100 Pip Renko chart, prices broke out strongly, rising above the resistance of 0.74. Currently, we notice prices trading choppy but there is reason to believe that we will not be testing the 0.80 handle anytime soon, although there could be small bouts of rally testing the key resistance level. A decline back to 0.74 could potentially mark a retest of the support level which was previously the broken resistance.
Looking to the 200 Pip EURGBP chart however, a decline to 0.740 would mark a reversal and this could potentially see the declines to 0.72. We will need to however wait for price action to unfold near these levels for further clarity.