I believe that some of the best trading opportunites come when there is a confluence of fundamentals and technical analysis. The GBPUSD is one such pair. Renko charts, when properly understood offers traders some great insights into price forecasting as well.
There are many examples on this right on my blog. For example, i’ve been calling an AUDCAD short for quite a while, well before today’s massive decline in AUDCAD. Besides, another example would be the CADJPY and NZDUSD, all of which were based on Renko technical analysis.
When applying these techniques to GBPUSD, we have a very interesting picture.
First, let’s take a look at a 500pip GBPUSD chart.
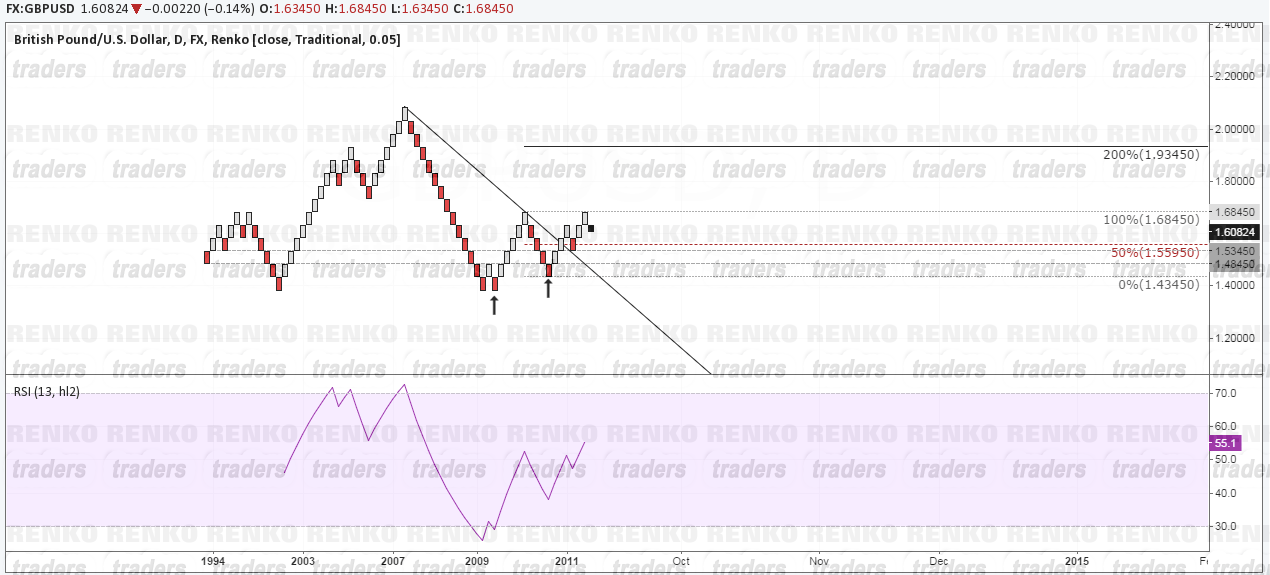
Here, we see that price broke a falling resistance trend line to start an uptrend. This view comes from the fact that price made a higher low before breaking the trend line. Once the TL was broken, price dropped back to test the resistance turned support at 1.5345 before pushing higher.
At present, it might seem as if price is starting to drop back lower, but we need to scale down to a lower pip renko chart. But before we do that, a final note. There seems to be an ascending triangle pattern being formed. The upside target is towards 1.9345.
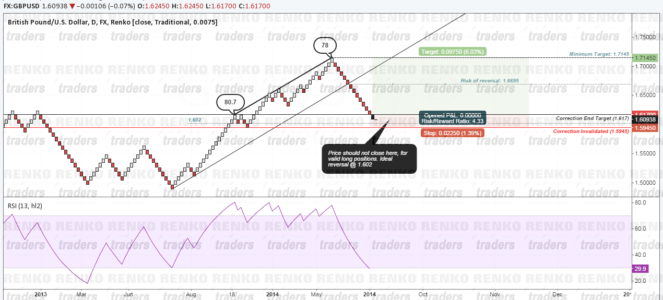
The next chart below is that of the GBPUSD 75pip box size. Here, we see a lot more actionable ideas.
First, there was a massive divergence building up, with a higher high being made when RSI made a lower high at 78, compared to the previous lower high at RSI 80.7. This alone told us a correction is due, targeting the 1.617 level.
With most RSI divergences, price should not break the low of the divergence, in this case 1.5945.
The Renko charts we use here, it must be noted are based on daily charts closing prices. Therefore, a long position in GBPUSD looks imminent as long as there are no bearish renko bricks confirmed at or around the region of 1.5945.
Ideally, a long position would come in at 1.617, with stops at 1.5945, targeting 1.7145 and 1.9345 eventually. While it can be tempting to go long, it is best to have some patience and wait for price action to give us a confirmation. After all, the trade itself gives a 1:4 RR at the minimum target.
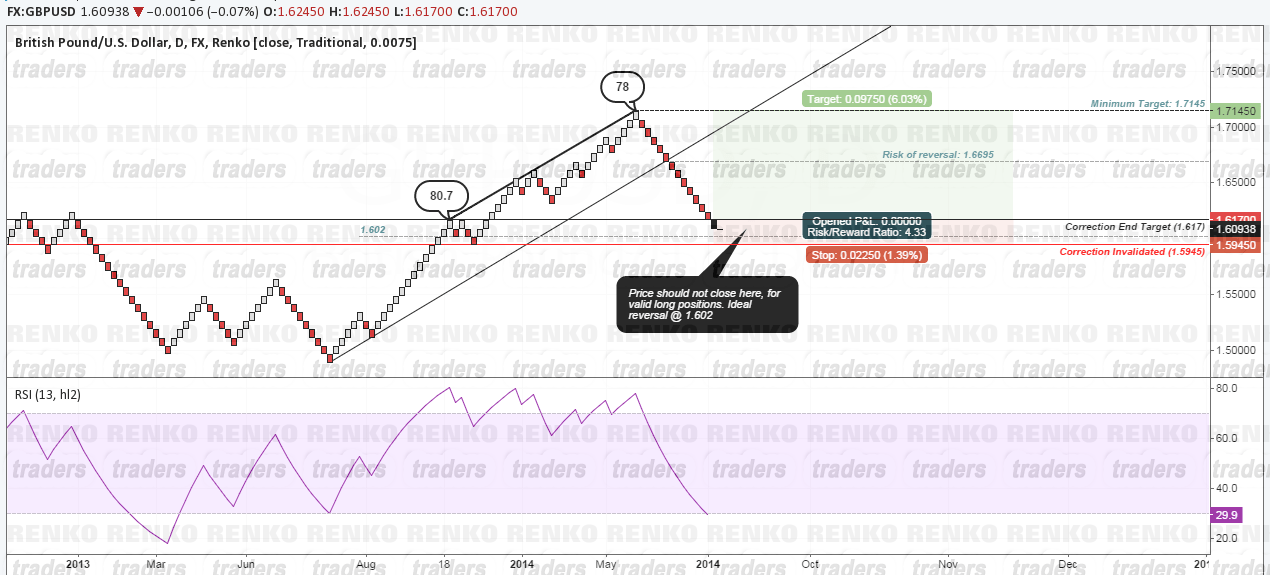
GBPUSD – The Game plan
Continue monitoring GBPUSD for further clues. For the long positions to stand, we must not have any bearish renko forming between 1.602 – 1.5945. As long as this level holds, we can take a small position at 1.617 and add to position on a retest of this resistance turning support level. To the upside, the targets come in at 1.7145 and 1.9345. But there is a risk of reversal near 1.6695, which needs to be kept in mind. Therefore, trading with a 3 units, with partial profits at each of the above levels and moving the trade to break even upon reaching 1.6695 would offer a safe entry. But of course, the above case comes into play provided GBPUSD does not close below 1.5945.