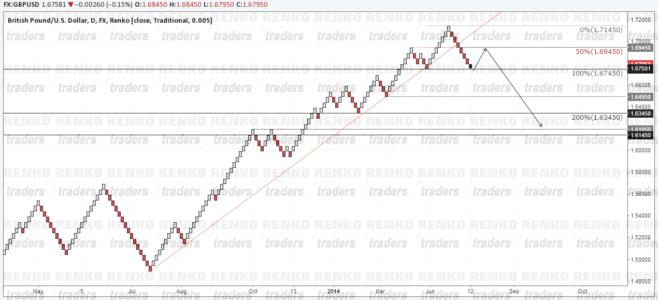
This analysis is a follow up to the previous renko analysis of GBPUSD where the downside target was give as 1.672. I happened to take a look at the traditional candlestick charts to see if there was some confluence.
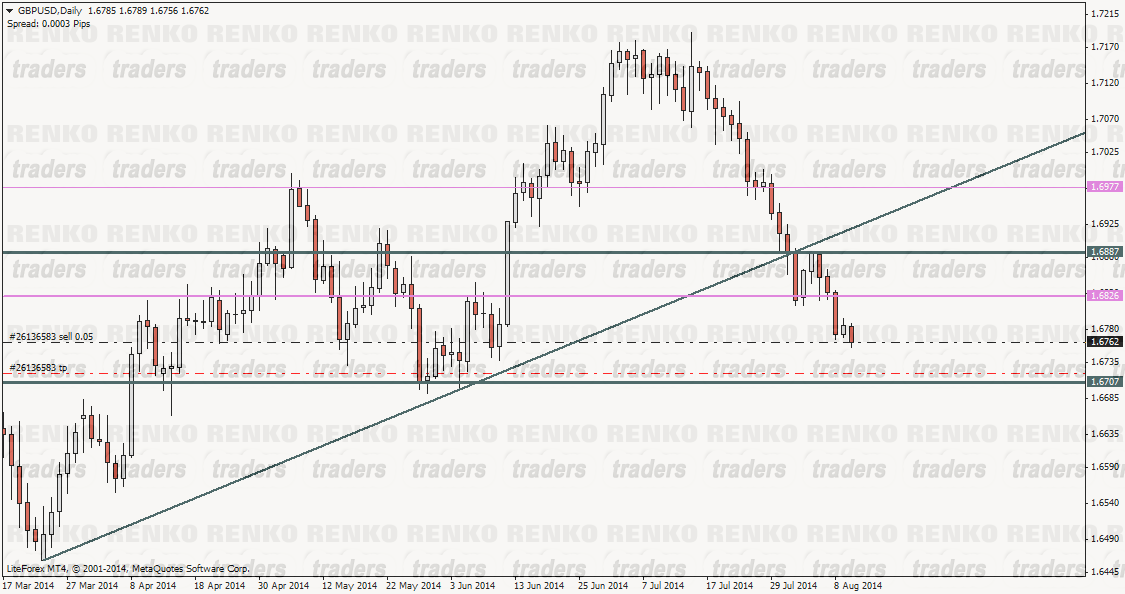
It is interesting to note that the level of 1.672 incidentally happens to be a strong support level where price managed to bounced off previously. The price action at this point looks to be making a head and shoulders pattern. The support levels and the left shoulder and head are already formed as shown in the daily chart of GBPUSD below.
Traders should note that this is a very long term trade idea which looks very promising as of now with the potential to catch some great pips both to the upside and to the downside.
So as per the Renko chart analysis, if 1.672 support holds, we can expect to see a small bounce to the upside. This is better viewed with the weekly charts. What we see in the GBPUSD weekly chart below is a break of a long term trend line. This break occurred at 1.6977 after which there was a strong bearish weekly candle.
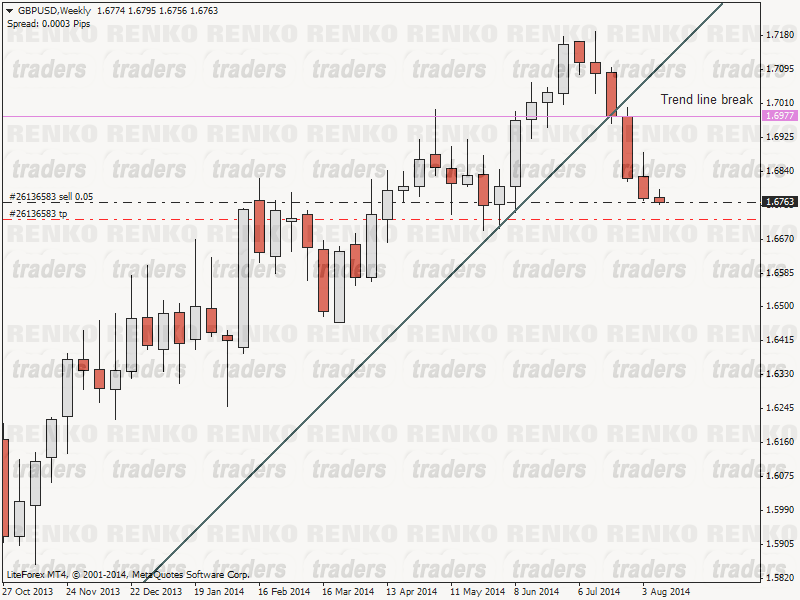
As with most price action with trend line breaks, price often returns to test the trend line break price before dropping further. Therefore, let’s assume that we can expect to see a rally back to 1.6977.
Now let’s switch back to the GBPUSD daily charts to see how this looks.
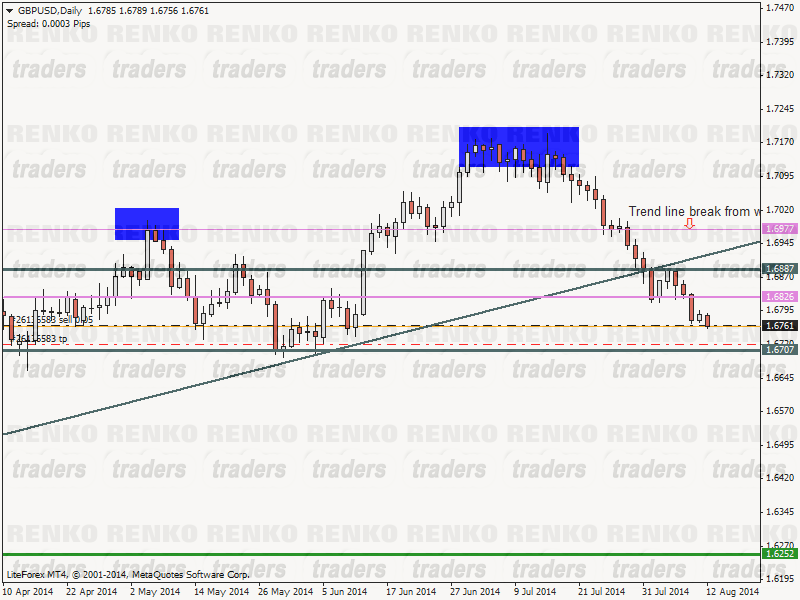
Notice how the upside target of 1.6977 comes quite close to the left shoulder’s price level?
In the event this happens, we can prepare for trading the head and shoulders pattern. Now when we measure this H&S with Fibs (basically to get the H&S target price), the head and shoulders pattern targets, 1.6252
Let’s take a look at GBPUSD Renko charts now and you’ll see something very interesting.
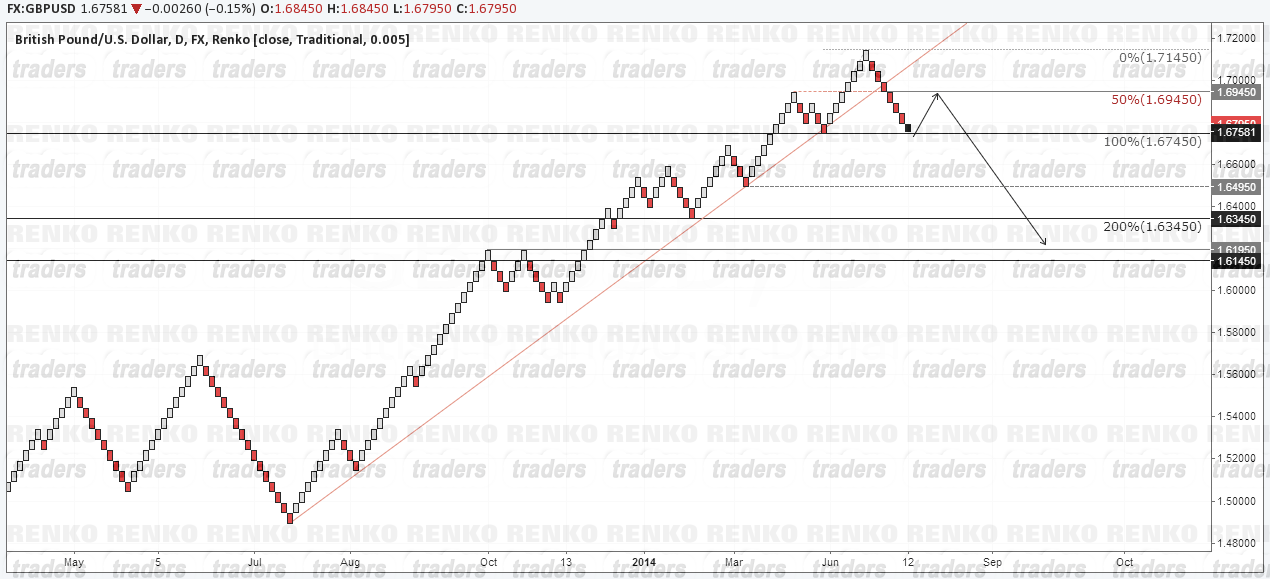
We again notice how the long term trend line which was well respected was broken. Price is certain to find support at 1.6745 region to go back and test the break of the trend line. Even the Renko charts show a potential head and shoulders pattern, with a target of 1.6345.
GBPUSD – Renko Trading Plan
- Continue to hold shorts targeting 1.672
- When 1.6765 turns to support, take a small long position targeting 1.685
- For the longs, preferably start with a very small position and scale into the trade
- Once 1.685 has been reached, place pending sell order near 1.698/1.7
- Scale into the trade once the right shoulder has been established
- The goal is to have a totally risk free trade + some profits by the time GBPUSD reaches the neckline support of 1.67 in order to target the large goal of holding shorts from 1.698/1.67 all the way down to 1.6345
- The duration for this trade could possibly take months and maybe well into end of this year through to early next year