
The NZDUSD renko technical chart below presents the larger overview of the market. With RBNZ monetary policy meeting due on 11th September, any possible bullish moves could provide a good selling opportunity.
In the chart below, we make use of the Trend line break renko trading strategy. This method shows a break of a long term trend line, near the region of .8398. By applying the methods of the trend line break, we get the target of .7984, a decent 425 pip move to the downside, and this would be just the minimum target, which means there is a potential for a further move to the downside.
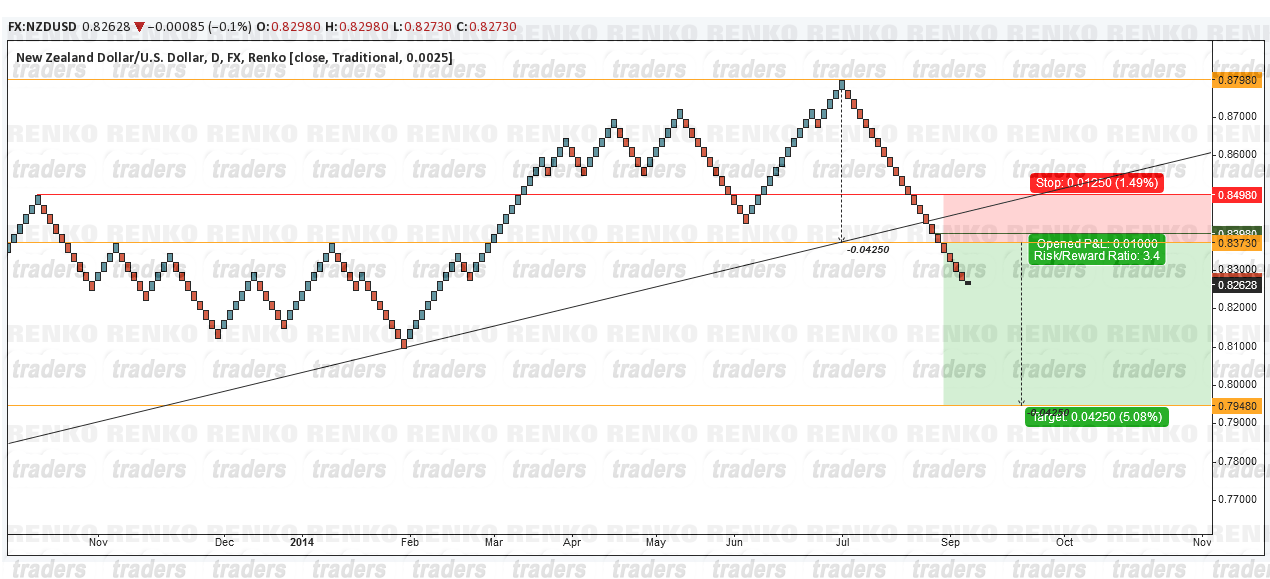
An important thing to note is that there has been no retracement after the trend line was broken. Therefore, if price doesn’t drop too much before the RBNZ meeting, we could see some retracement back to .8398 which would offer a great short entry into NZDUSD. The stops would come in at .8498, thus effectively giving a risk/reward of 1:3.