
The Canadian Dollar has been the second best currency on a year to date basis, gaining 4.27%, only next to the Japanese Yen. The Canadian dollar’s gain came amid the BoC holding rates steady and a moderate improvement in the Canadian economy. More recently, Canada’s new budget which includes a large amount of fiscal spending is being seen as a positive for the currency. Contrasting to policies elsewhere where Central Banks continue to grapple with growth while governments cut back on spending.
Oil prices are another factor worth considering as prices have shown to be quite resilient with talks of a bottom in place. Higher Oil prices have seen a strong correlation to the Canadian dollar and with Oil prices likely to push higher in the near term, the Canadian dollar is likely to see further gains.
In this week’s trade idea, CADJPY makes for an interesting currency pair to consider. Make no mistake, that the Canadian dollar is still weaker, relative to the Japanese Yen, but in the medium term (month to two months), CADJPY could be looking at making some decent gains.
CADJPY – Renko Technical Analysis
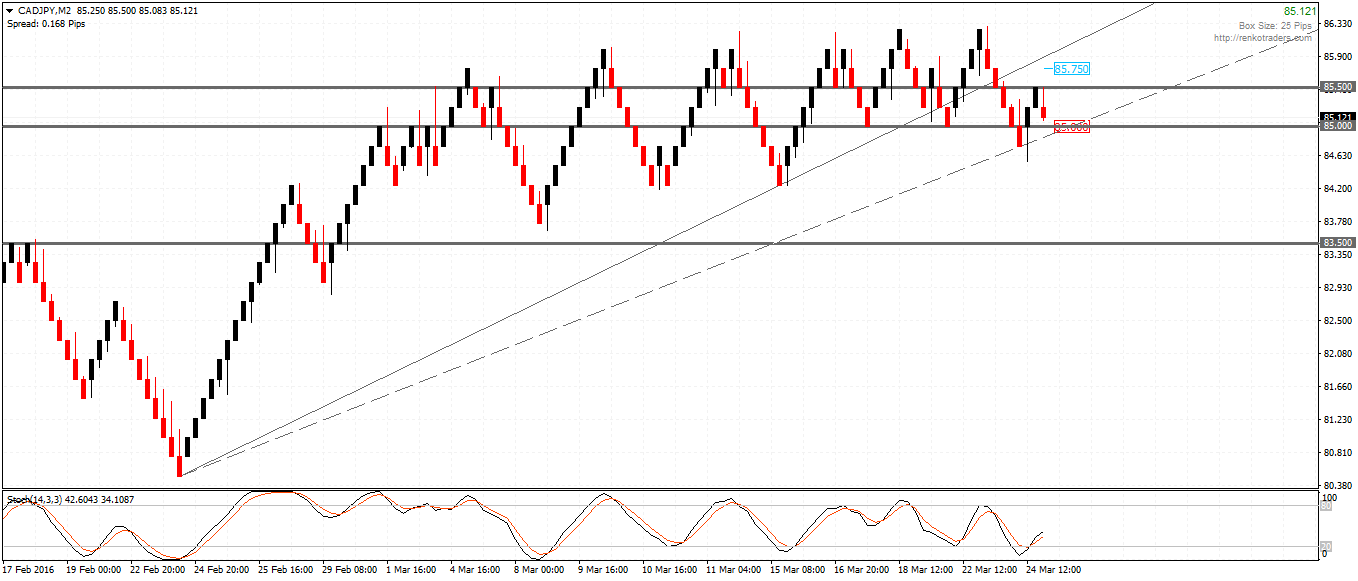
The 25 Pip CADJPY Renko chart shows have topped out near the 86 – 86.25 level, with multiple attempts near this resistance proving to be strong enough to contain the rallies. Meanwhile, the Stochastics oscillator has been continuously printing lower highs, signaling a short term correction in prices.
The trend line you see on the 25 pip CADJPY chart below was broken near the 85.50 level. Prices briefly pulled back to retest this trend line break level. Support is identified at 85.0. We expect that a correction that will resume on break of this support level, which could see prices fall towards 83.50 lower support which is confirmed with the bearish divergence on the Stochastics.
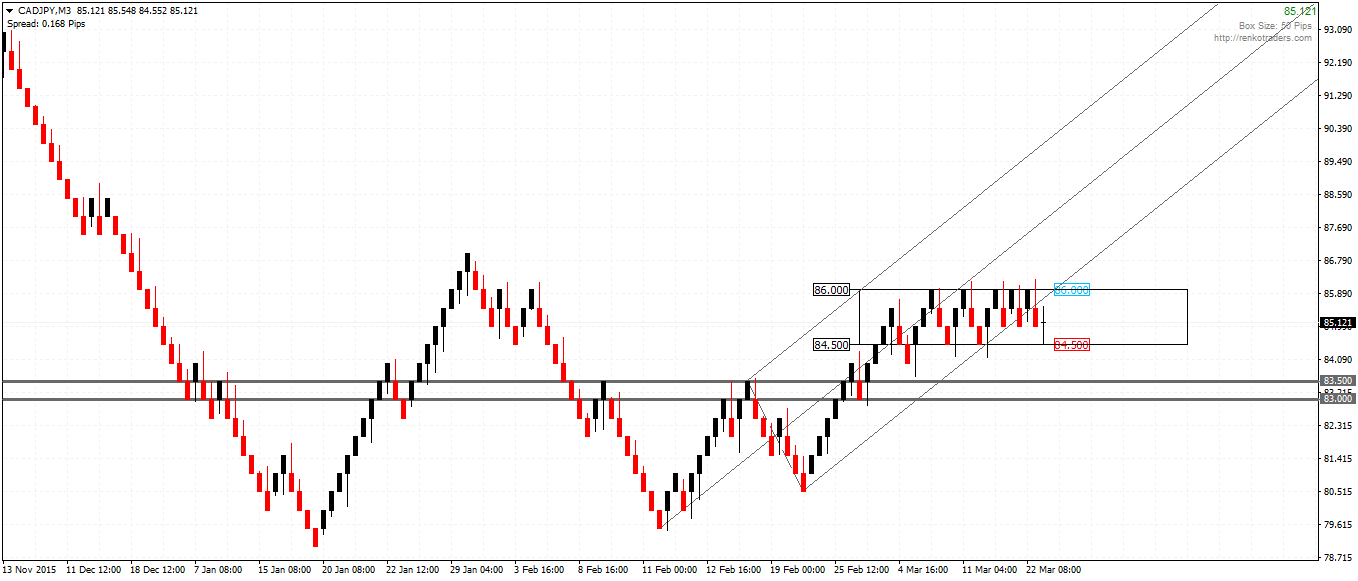
On the 50 Pip CADJPY Renko chart, prices have been stuck in a range within 860 and 84.5. A break below the 84.50 will confirm a move towards 83.50 – 83.0 to test the previously broken resistance level for support. This view is further supported by prices breaking out from the lower rising median line and failure to move back to the median line on previous tests to the lower median line.
Finally, the 100 Pip CADJPY Renko chart shows a bullish divergence which points to a correction towards 88.0. Combining the technical analysis from the 25 and 50 pip chart for CADJPY we can therefore deduce that CADJPY is likely to fall towards the 83.0 support level. If the current 100 pip Renko bar closes bearish at 84.0, then price action could continue lower validating the test to 83.0.

In the longer term, buying CADJPY near 83, with stops at 80 could see an upside move towards 88. This gives a risk/reward ratio of 30 pips in risk and 50 pips in reward.
However, the immediate focus would be to trade CADJPY to the downside with selling at market or within 85.5 – 85 and targeting the 83.50 – 83.0 levels. The short set up would be invalidated if prices rally back above 85.50 to close at 85.75.