The markets definitely got off on the wrong foot in 2016 with a strong decline being posted and with the second week of February already upon us, the equity index shows no signs of letting up. The Renko chart for S&P500 Index paints a rather gloomy picture with further downside in store.
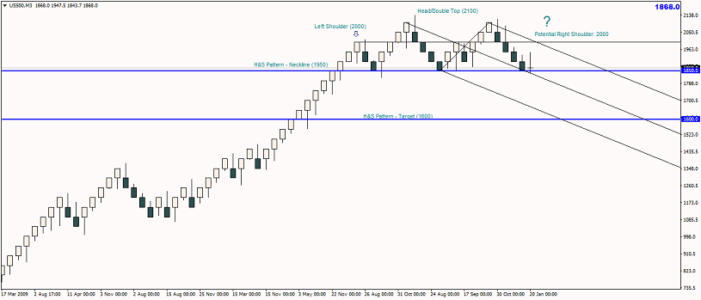
While still premature, what we do have is a double top formation on the 50point fixed Renko chart for the S&P500. The double top, formed near 2100 has as baseline support near 1850, where prices are currently trading. A rebound off this baseline could see a potential move to as high as 2000. Incidentally, this would mark the formation of the right shoulder for the S&P500 index. A dip back to the 1850 baseline and a subsequent break below this support level will trigger a key drop to 1600.
The chart below shows the S&P500 Index, 50 point Renko chart. The median line plotted on this, indicates a possible reversal, but of course, one which will be confirmed only on a close to 1950, which is another minor resistance level of interest. We can anticipate prices to remain range bound within the 1850 – 1950 region, following a breakout higher.
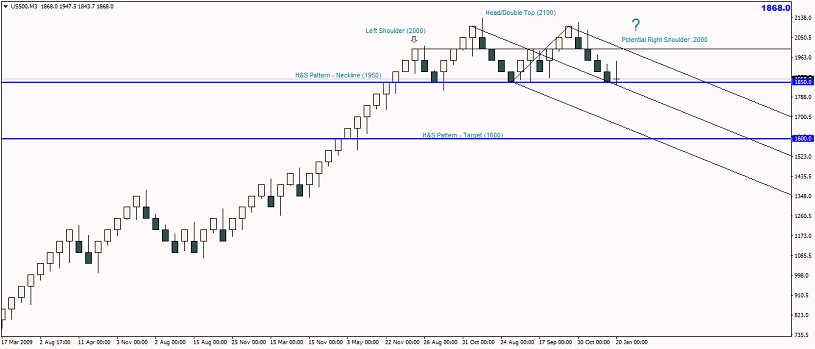
The pattern and the analysis remains invalidated, should we see a break above 2000, in which case, a move to 2050 is likely and one which would put the head and shoulders pattern to question.
For the moment, it is best to stay on the sidelines and watch for price action to evolve near the 2000 threshold, with potential short opportunities coming in at this key psychological level.