
The Japanese Yen has been in focus since the start of the year. While the Bank of Japan attempted to weaken the Yen by introducing negative interest rates in January, the Yen was unwilling to give up and continued to strengthen. The markets were filled with a lot of noise, figuratively speaking and with the dust now settling, some patterns are clearly emerging.
If you are trading USDJPY, here are three signals that shows the potential upside in USDJPY, to 117.0 at the very least. We take a look at the 100 Pip USDJPY chart, which if the readers might remember was what started the long term short positions sometime last year. You can read more about that in this article here.
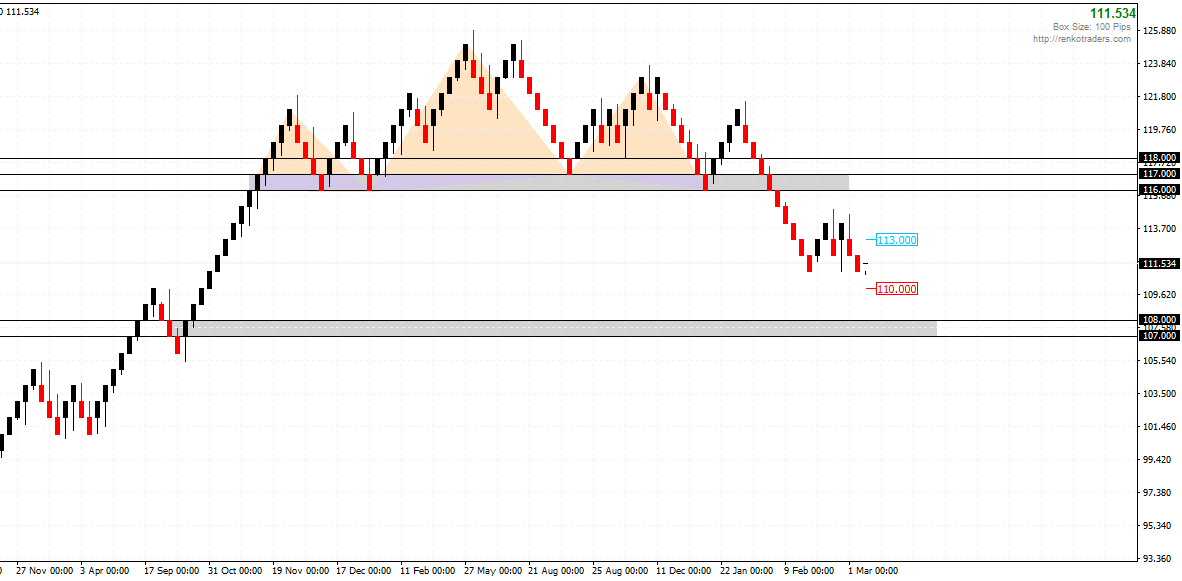
1. USDJPY – Head and Shoulders pattern
While the long term bias is still to the downside, the chart shows that USDJPY is likely to see a pullback in the near term. The head and shoulders pattern blow shows the neckline support at 117 – 116 being broken which resulted in prices falling sharply. The measured move target comes to 108 – 107 region. This head and shoulders basically lays out the long term bias in USDJPY, which is to the downside.
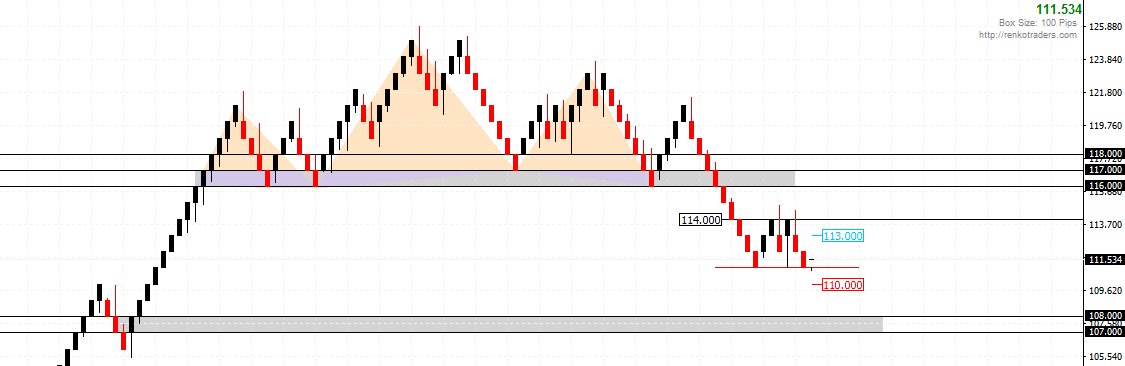
2. USDJPY – Double Bottom
The current double bottom formed near 111 with the resistance near 114, shows a potential breakout to the upside towards 117.0 the head and shoulders support level. While its too early to tell and there is always the risk of USDJPY failing the double bottom and continuing to push lower (to 108 – 107) a turn around here could see a pullback in the longer term bearish declines. It also validates the point of retesting the broken support level at 117 – 116 to establish resistance. So the key risk here is a move to 117 if 114 resistance breaks and a move to 108/107 if 111 support fails.
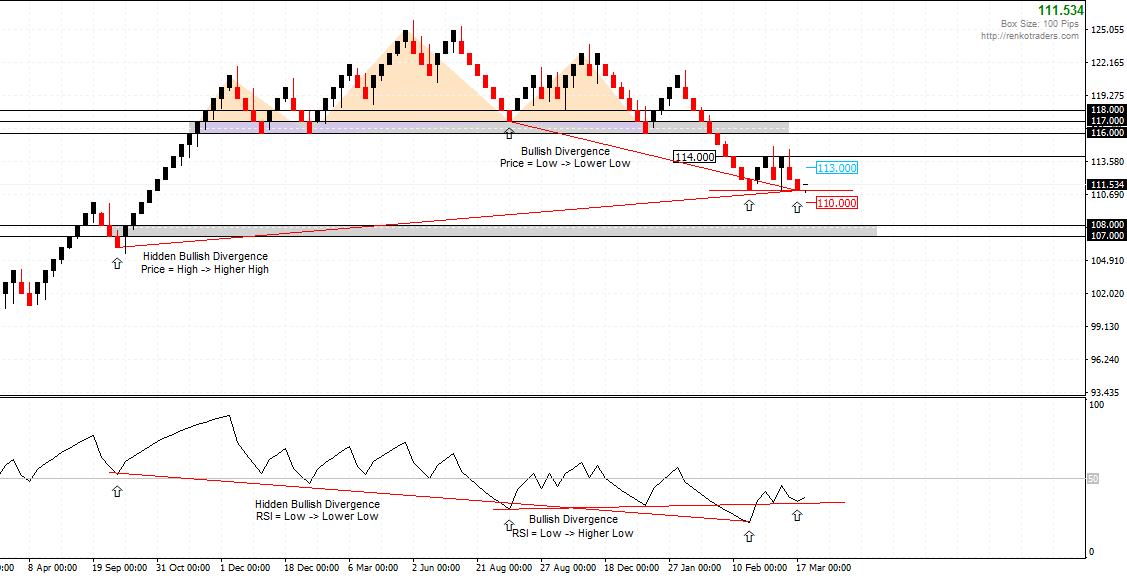
3. USDJPY – Divergence Confluence
The next signal which binds it all together are the divergences we see.
There is a hidden bullish divergence alongside a regular bullish divergence, both of which show that support at 111 is likely to hold out very strongly (confirmed by the double bottom as well). The next likely move, is a correction to 117, shown by the bullish divergence (which now fits in with the test of resistance on the 117 – 116 broken support).
From the above, we can therefore conclude the following:
- USDJPY remains bearish with an eventual target to 108 – 107 level to complete the head and shoulders pattern
- Price action has currently stalled mid way and the double bottom pattern combined with the divergences shows a retest back to the broken neckline support at 116 – 117
- If the retest to this resistance is successful, USDJPY could resume a new leg of declines lower
- The downside bias gets invalidated if price closes above 117 and potentially test the level to form support
- Alternatively, if prices fail at the 111.0 support near the double bottom, we could expect a dip to 110