With less than 6 days to go for the US Federal Reserve to meet and decide on the interest rate policy with a strong conviction that the Fed will be hiking rates on December 16th, the US Dollar Index is definitely an instrument to watch in order to gain perspective and the larger context of what the markets are likely to do.
This special US Dollar Index Renko Technical analysis deals with just that and the results are interesting, should the analysis turn out to be right.
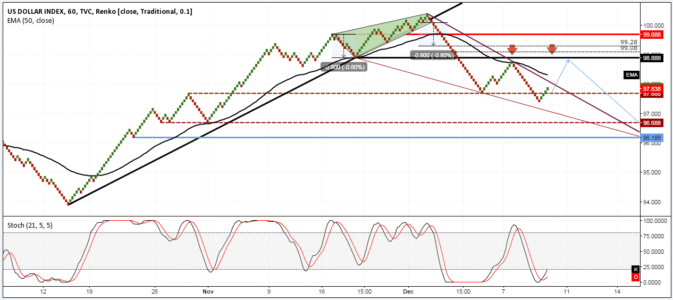
We start off the US Dollar Index Renko technical analysis based on the 10 point fixed renko chart.
Please take some time to observe the chart carefully before reading the points below.

We observe the following:
- Prices were climbing in a steady uptrend off the initial starting price at 93.88 with the trend line being tested as prices edged closer to making new highs.
- On the first retest to the trend line near 98.88, the US Dollar Index started to consolidate into a rising wedge pattern and after peaking out at 100.38, the US Dollar Index started its sharp descent to 97.68 with little to no retracement to the break out.
- Based on the measured move principles, prices fell beyond the estimated 0.80 point target range. However, it is worth noting that 99.28 would have marked the minimum price level.
- Prices then found support off 97.68 before rallying higher, only to fail below the resistance of 98.88 and saw a complete reversal at 98.78, which saw the Dollar Index fall back to 97.68 and dipping a few boxes lower.
- In the downtrend, prices have chalked out a descending wedge pattern and a potential breakout here could see a minimum rally to 98.88.
- We do not rule out a modest decline lower back to 97.68 in order to establish support yet again ahead of the rally, which could happen after prices break out from the trend line (thick line).
- The measured move to the upside near 98.88 (and considering 99.28) makes for a good level from where prices could see a reversal back lower.
- The downside bias comes based off the bearish divergence in prices with 96.18 being a conservative target, following the two support levels near 97.68 and 96.68
- The potential resistance on the falling wedge breakout comes to 99.28 – 99.08, which would see a completion of the bullish divergence we currently have.
The downside bias remains invalidated should we see prices closing above 99.28 region, in which case, the US Dollar Index could continue to post a new high or could simply rally higher to flush out the potential shorts before resuming the downtrend. Another factor to note is to pay attention to the price levels of minor support at 97.68, 96.68 and 96.18
Translating the above analysis into trading
Given that the Euro is given the highest weightage, we can expect to see the Euro move in the opposite direction to that of the US Dollar Index. Likewise, the Yen could also see a potential move higher. EURUSD and USDJPY to a lesser extent are therefore two important currencies worth noting.
On the EURUSD, which is of concern, we can expect the Euro initially decline lower into the Fed’s decision next week. The US Dollar could possibly continue to strengthen into or up until the meeting so long as prices manage to rally to 99.28 – 99.08 level.
Once the US Dollar Index reaches this level, traders can apply their own analysis on the EURUSD and look for long positions. 1.11, 1.12 are two levels of immediate interest while 1.20, 1.25 and 1.28 remain the longer term targets.