The USDJPY has practically been ranging for the most part of this year. With the Bank of Japan remaining on the sidelines, the USDJPY’s moves came largely due to the Federal Reserve’s FOMC than anything else. Of course, there was the October BoJ meeting which saw some economists expecting further easing from the Japan’s Central bank which saw the BoJ stand pat on policy.
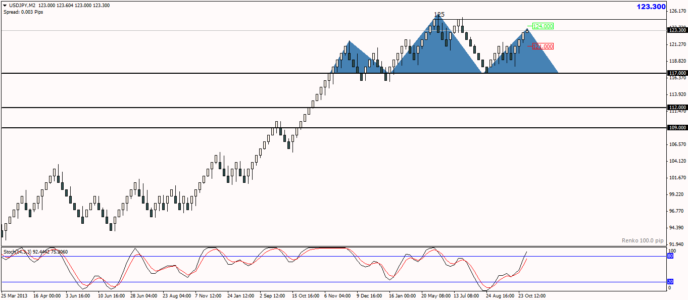
The 100Pip Renko box chart for USDJPY paints an interesting picture and something, I must admit happened to be discovered by chance. There is a potential head and shoulders pattern taking shape right now, with the neckline coming in at 117. A break below 117 could possibly open the gates to test 112 marking the 161.8% move followed by 109 a picture perfect measured move target to the downside.

The question of course, is how much further will USDJPY rally before it starts to post the declines. For starters, 125 marks the top, validated by the double top pattern and the bearish divergence to the Stochastics. The current rally is likely to see a test to 124 at the very least, which could signal the top of the right shoulder, off the 100 pip renko chart.
Moving to the 50 Pip Renko chart for USDJPY, we see that the Stochastics has already printed a hidden bearish divergence failing to confirm the lower highs in prices and instead posting higher highs off the tops near 124. Prices are also currently trading near the upper end of the rising price channel which is acting as dynamic resistance. If this resistance holds, we could anticipate a break down in prices to 121 – 121.5 region. Only a close below 121.5 – 121 on the 50 Pip chart will signal the start of a larger reversal which when taken in conjunction with the 100 Pip chart, will see a downside move to 120.
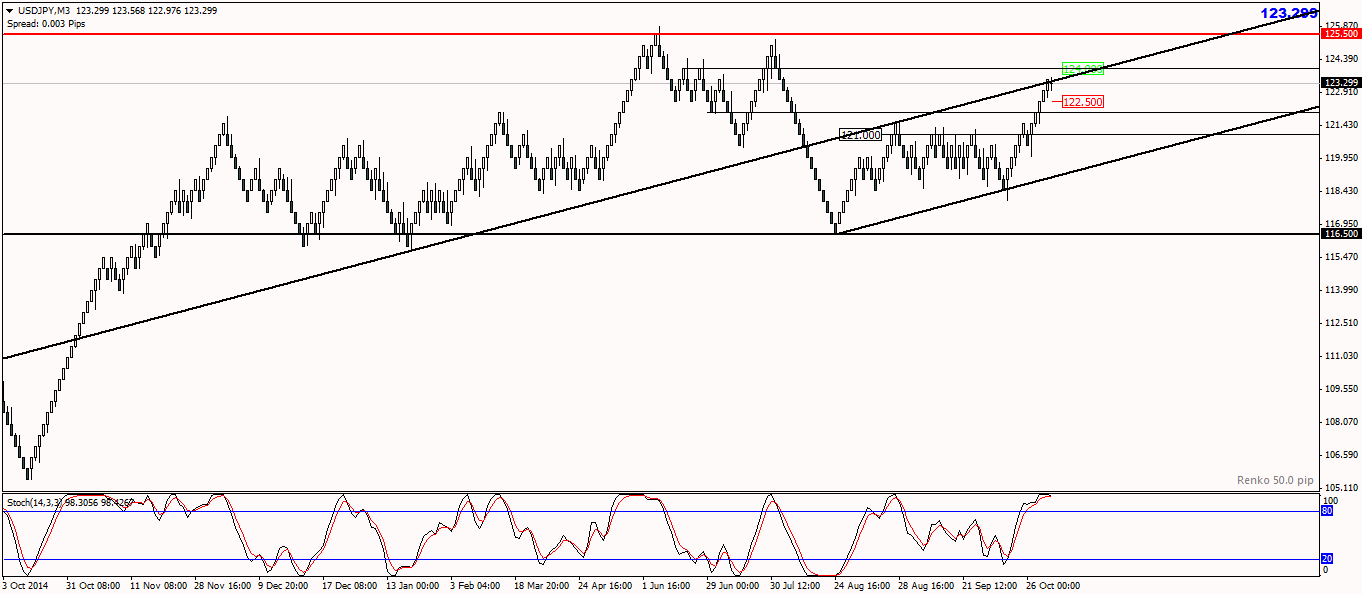
Good position management is required here given the fact that prices are trading near the top end of the rally. Booking partial profits at 121.5, 121, 120, 117, 112 and an optimistic 109 will be a great trade set up enter. There is a risk of a potential rally to touch the 124.5 level which is another factor to consider.
All said and done, USDJPY looks like it is ripe for a possible decline/correction.