While traders continue to complicate forex trading searching for the Holy Grails and at the same time trying to hop on from one trading system to another, the only end result for this kind of an approach results in more confusion, which is one of the last things a trader would need to be worried about. It is true in the saying that beauty is in keeping things simple.
The same goes for forex trading as well. So, while conventional wisdom teaches us about Stochastics, Moving averages and candlestick patterns, there has been a rather age old form of charting which strangely hasn’t caught up much within the trading fraternity. And assuming it has, it has been kept a rather well guarded secret.
Introducing Renko Charting – Price is all that matters
Renko charts or bricks, is a form of charting method that was developed in Japan, according to the book, Beyond Candlesticks by Steve Nison. The name renga refers to bricks.
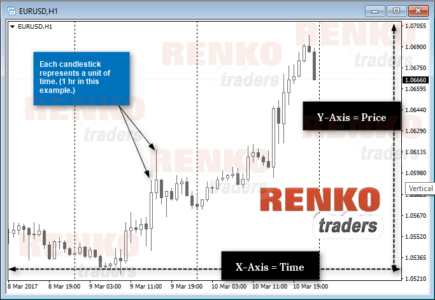
Renko charts are perhaps one of the simplest of chart patterns. Most importantly, the only variable in the Renko charts are the bricks, depicting price movements and nothing else. Conventional charts such as Candlestick, Line and Bar charts take into consideration two variables; Price, plotted on the y-axis and Time, plotted on the x-axis.

Talk about price action trading, nothing can be more pure than trading with Renko charts. The Renko bricks also present a very nice visually appealing structure, which to the untrained eye might seem somewhat peculiar. But some closer attention will reveal some underlying facts about price which might have missed with the traditional charting forms.
Renko charts are only price dependent making them one of the best ways to trade pure price action
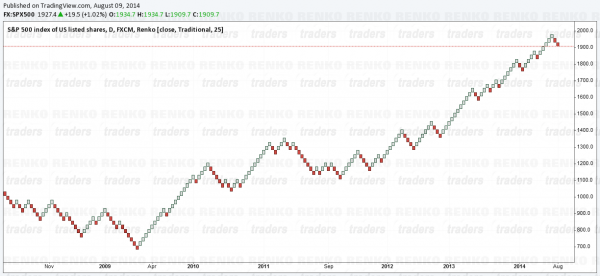
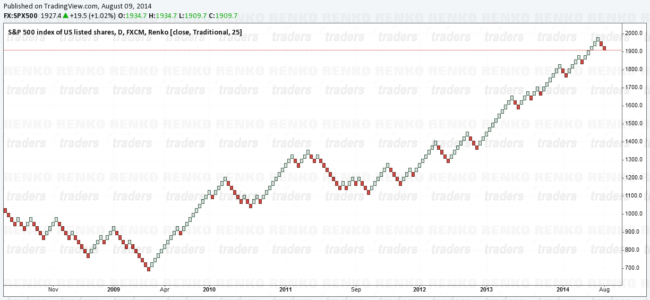
The chart below shows the S&P500 CFD index 25 box size Renko

Constructing the Renko Charts
Renko charts are very simple in its construction, which should be obvious by now, looking at the chart above. Because price is the only variable, Renko bricks are configured to price movement. For example a 10 Pip (or Point) Renko would infer that a new Renko brick is plotted when price moves 10 pips (or points) above the previous Renko brick. There are different ways to configure the Renko charting. They are:
- Fixed Pip or Absolute Close
- ATR based dynamic Absolute close
- High/Low
Although the bricks may vary a few pips, there is no remarkable difference in the renko charting. Learn about the difference between ATR and a fixed Renko chart.
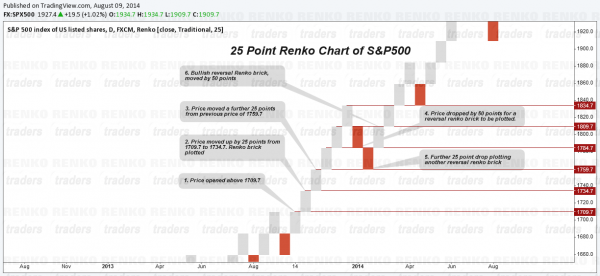
Let’s take a closer look at how the Renko bricks are formed and plotted.

- From previous price of 1709.7 the S&P rallied 25 points higher to 1734.7, thus plotting a new Renko brick in the same direction
- As price continues to rally by 25 points, subsequent Renko bricks are plotted
- For reversals, we need to see a 50 point drop for a bearish Renko (or reversal Renko) brick to be formed as seen by a drop from 1834.7 to 1784.7
It is due to this unique construction of Renko charts, which gives it a layered brick approach. For a more detailed explanation on how the Renko chart is plotted read this article.
Benefits of Renko Charts to other chart types
- Because Renko Charts are pure price action, there is no noise in the charts
- Renko charts are not time dependent but price dependent. Therefore, there are no time frames with Renko charts
- Support/Resistance can be easily plotted with Renko charts
- Trends are well established with Renko charts
Renko Charts therefore offers a very stress free way to trade. It is beneficial for both beginners to trading as well as experienced traders, who would be able to use their charting skills which can very well be applied to Renko charts as well. Besides the above classic Renko charts, other variations include the median Renko or mean renko chart.
If you are considering trading with Renko Charts, give them a try.

