
Renko chart price action trading is something traditional chartists will absolutely love.
This is because of the ability to view clear trends using this chart set up. Furthermore, with renko chart price action trading, you can see support & resistance levels clearly. It is not surprising then, that a Renko chart is considered to show a noiseless approach to trading. But certainly, Renko charts do find competition with other unconventional chart types too. Take for example the range bars.
An interesting point to consider is the aspect of subjectivity in price action trading. You can see a head and shoulders pattern, but someone else will see an inverse cup and shoulder pattern. This is common when you trade price action with regular conventional chart types.
Of course, renko charts are not immune to this.
But because they depict price in a clean trend, you can spot these price action patterns very easily.
Price action trading with Renko charts is easy
Regardless of what your trading preference is, be it trading triangle patterns, or the famous head and shoulders pattern, or just trading with support and resistance lines. You can do this all using a renko chart.
Price action trading with Renko charts is much easier and helps in removing the subjectivity a bit more. So if you have any experience of analyzing the markets with conventional chart types, you can get started with renko price action trading with ease.
Of course, there are times when some patterns in Renko could make a trader to think twice, such occurrences are usually rare. And if in doubt, leave the trade set up aside and pick a better pattern to trade.
One of the exceptions to renko chart price action trading is however the bricks themselves.
Because Renko bricks can be either bullish or bearish, there are no inside bars or engulfing patterns. However, the previous trend, and price in relation to the trend should be enough to guide a trader to take an entry, depending on how the price action chart pattern plays out. Read here to know what is a Renko chart if you haven’t already.
Renko chart price action trading – Example
In this article, we give a brief introduction to some price action trading examples with Renko charts.
For the rest of this article, we make use of a fixed box size renko.
Unlike candlesticks or line charts or even bar charts, Renko charts show two main important factors for a trader.
They are:
- Trend
- Support/Resistance
While this might seem a bit disappointing, the above two elements are in fact the only thing a trader really needs. This perhaps could be best illustrated by the following EURUSD chart where we use a 50 pip fixed box renko.
Visualizing trends using Renko charts
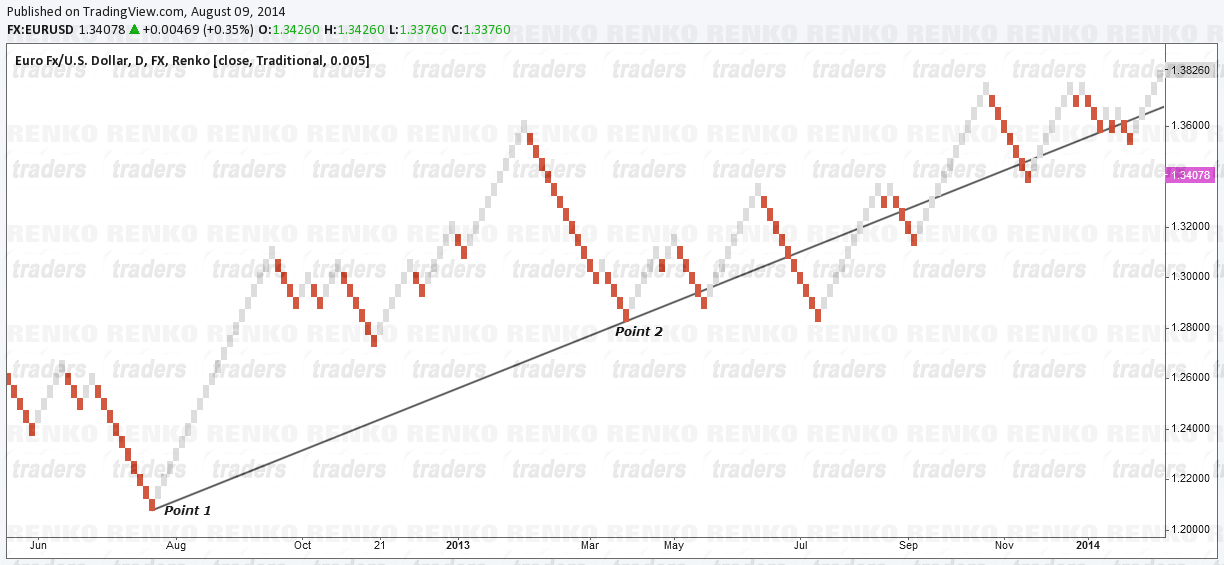
The first things we notice is an uptrend that is in play. We go on to plot a trend line, connecting the two points shown on chart. Assuming that we plot this trend line after the next correction, the question that comes to mind is where to enter this trend.
The next thing the Renko chart price action trading chartist would do is to look to the left to find out previous support and resistance levels as depicted in the chart below. This is sometimes also referred to as Market Structure.
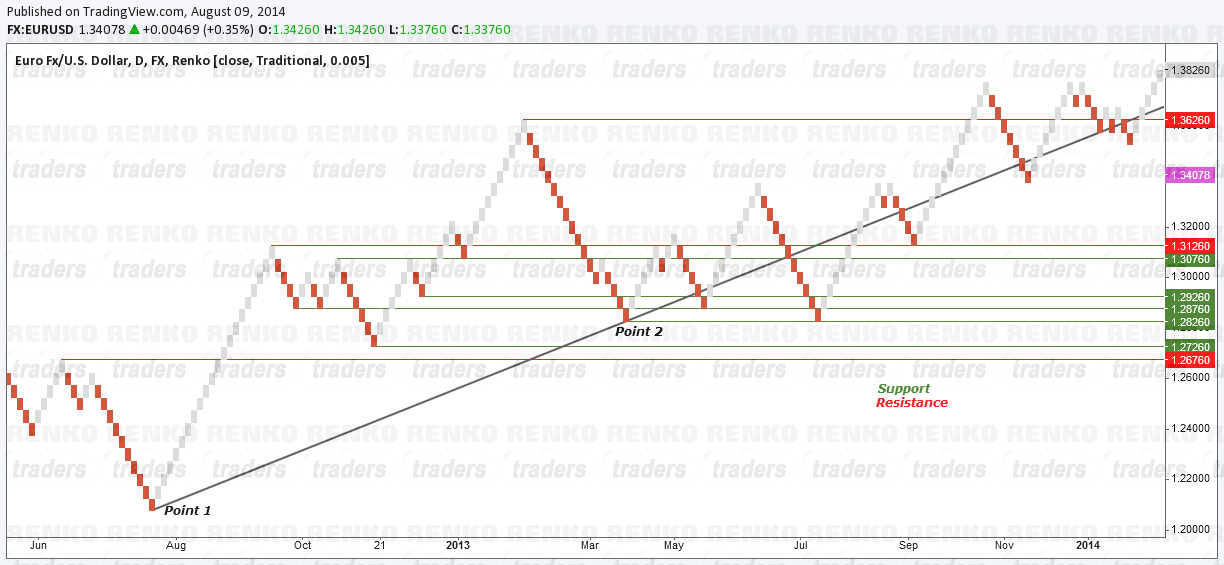
Now that we have an idea of possible levels price could correct to, the final question is of the entry.
Visualizing Renko support and resistance levels
In the renko price action chart below, we now see retracement to a previous support level of 1.28260. This support level is of good importance because it happens to be a support level of the trend line as well.
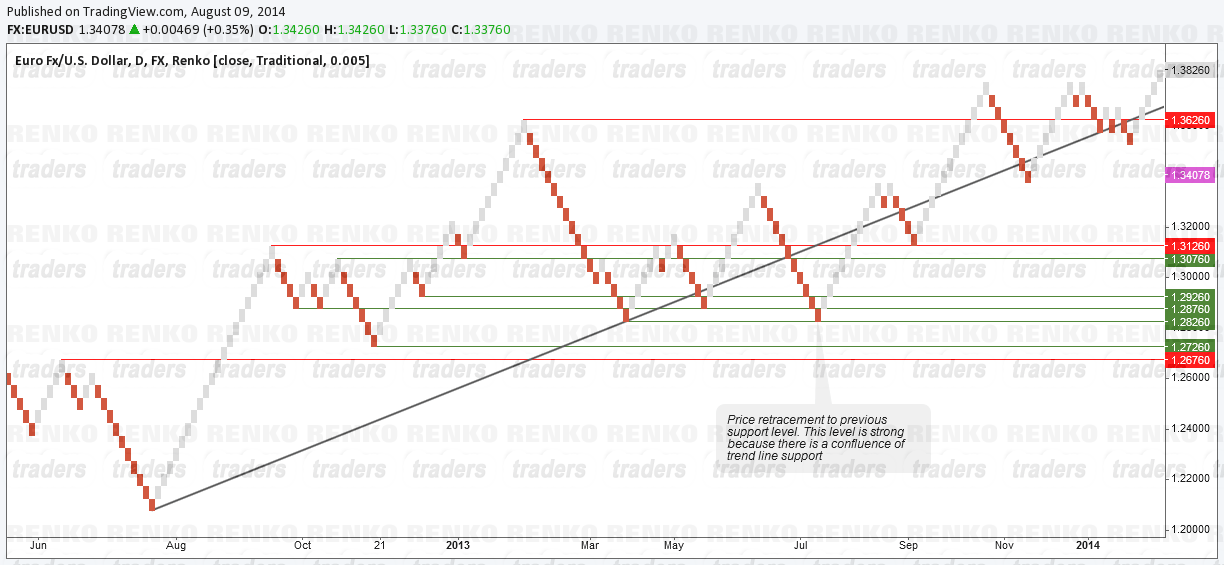
As price reaches this key support level, the astute Renko price action trader would first wait to watch if a new bearish Renko brick would be printed below this level. Given that we are trading a 50 pip fixed Renko brick, this would mean that for the next bearish Renko to be printed, price would have to drop to 1.27760, which would indicate a possible break of this key support line.
However, we see a bullish Renko being printed. The next step is to look left at this price zone. What we notice here is that there were instances of bearish price action, which tells us to look for a safer entry. An aggressive trade however would be to buy at the top of this bullish Renko at 1.2926 with stops below the key support of 1.2826.
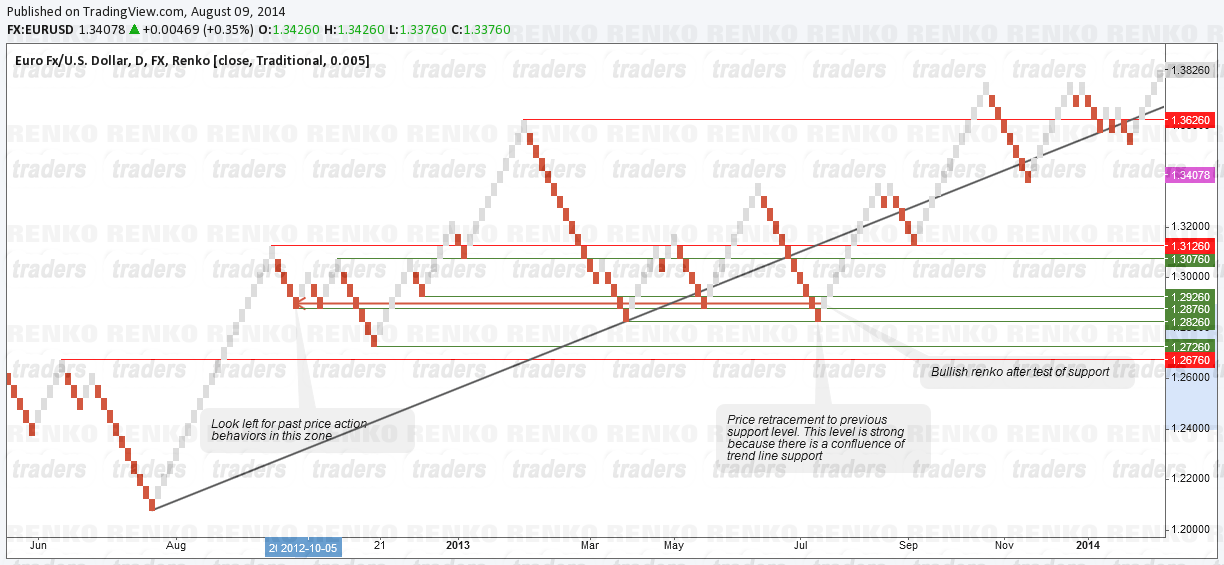
The renko chart price action trader would notice that price action in the markets has been mixed. We can also see another support (which could possibly turn resistance) level right above at 1.3126 through 1.3076.
Renko chart trade set up – Different ways to enter the trade
The aggressive entry would be to target this level for a partial close while moving the remainder of the trade to break even.
An even safer entry is be to wait for a breakout from this potential resistance level. Or you could just wait for the resistance level to turn to a support level.
renko chart price action trading requires a lot of patience and confidence in your analysis
As expected, price comes back to test this resistance as it turns to support, which is all the confirmation a Renko trader would need. So a long position would be initiated at the high of the bearish Renko brick at 1.3176, with stops coming in below one of the previous bearish Renko bricks. This price level is of important as it is also one where resistance turned to support.
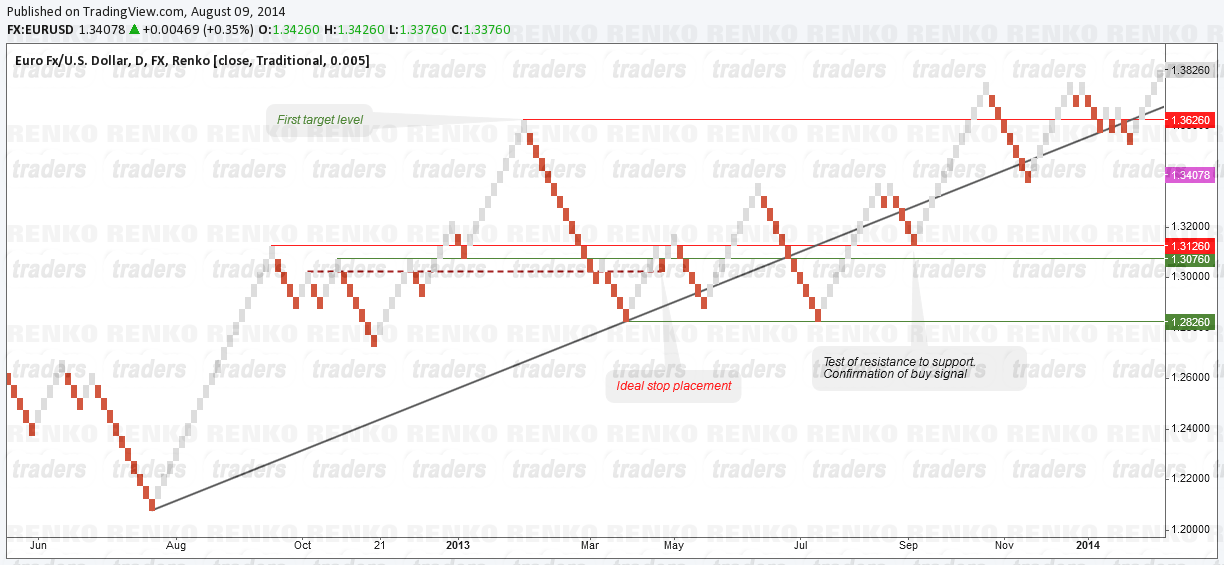
This price action Renko trade set up would then target the first level at previous high of 1.3626. In terms of risk/reward, the stops were placed 3 bricks below or 150 pips, while the first profit target was 450 pips, and leaving a much larger target if the right approach was taken.
Renko Chart Price Action Trading – It takes patience!
To summarize, renko charts price action trading requires a lot of patience and confidence in your analysis. You can use our free renko chart to see how it all fits in.
The above example, while seemingly simple in hindsight, would have definitely tested a trader’s patience while waiting for the retracement to the key support happened. Read about using the w pattern in renko trading to get an idea of how renko price action trading strategy.
It would have tested the nerves of the trader when the bearish Renko bricks kept coming close to the key support level and would have at least until price moved comfortably higher from the entry price.
However, those with patience and discipline would have been rewarded in this trade with a massive 450 pips of initial profit with much larger scope had the trade been kept open.