
In the previous trading strategies, most of the divergence based trade set ups were primarily using either the Stochastics or the RSI indicator. While divergence is common across any oscillator that you use, there is a certain element of risk involved when it comes to using the regular oscillators.
In other words, there is a good chance that price can rally back in the event of a bearish divergence and post a new high, thus stopping out the trade despite being correct on the bias.
One way to address this issue is by using a histogram oscillator. Of the many histogram oscillators (MACD, OsMA, AO, AC), the Awesome Oscillator offers a good fit. In this Renko trading strategy we make use of the Awesome oscillator with Renko charts in order to find trade set ups based on divergence.
Renko Divergence with Awesome Oscillator Chart Set Up
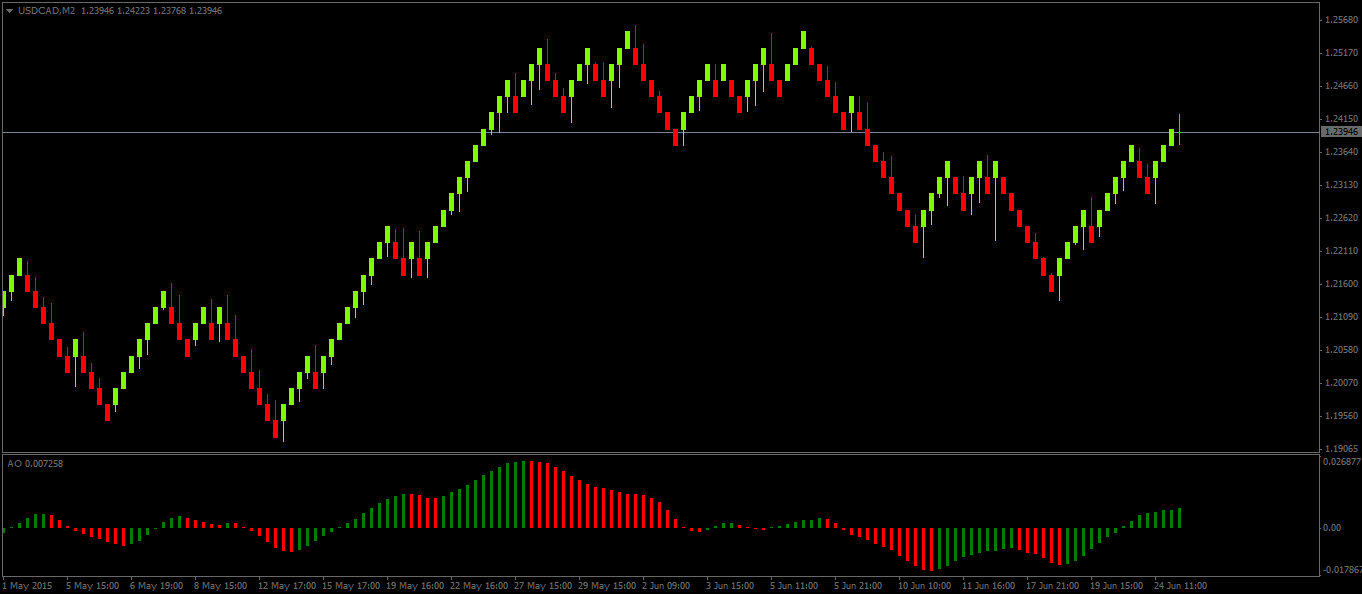
The chart set up is relatively simple. After you load up your Renko bars, simply add the Awesome Oscillator to your chart. The chart set up should look as follows. In the chart below, we make use of a 25pip Renko chart with the Awesome oscillator.
Divergence Set Ups with Awesome Oscillator
For Short positions we look for bearish divergence. Meaning that price makes a higher high and Awesome oscillator makes a lower high.
Once the set up is spotted, for trade trigger, we wait for the Awesome oscillator to print a bearish signal (histogram crosses below 0 printing a Red bar).
The chart below shows an example.
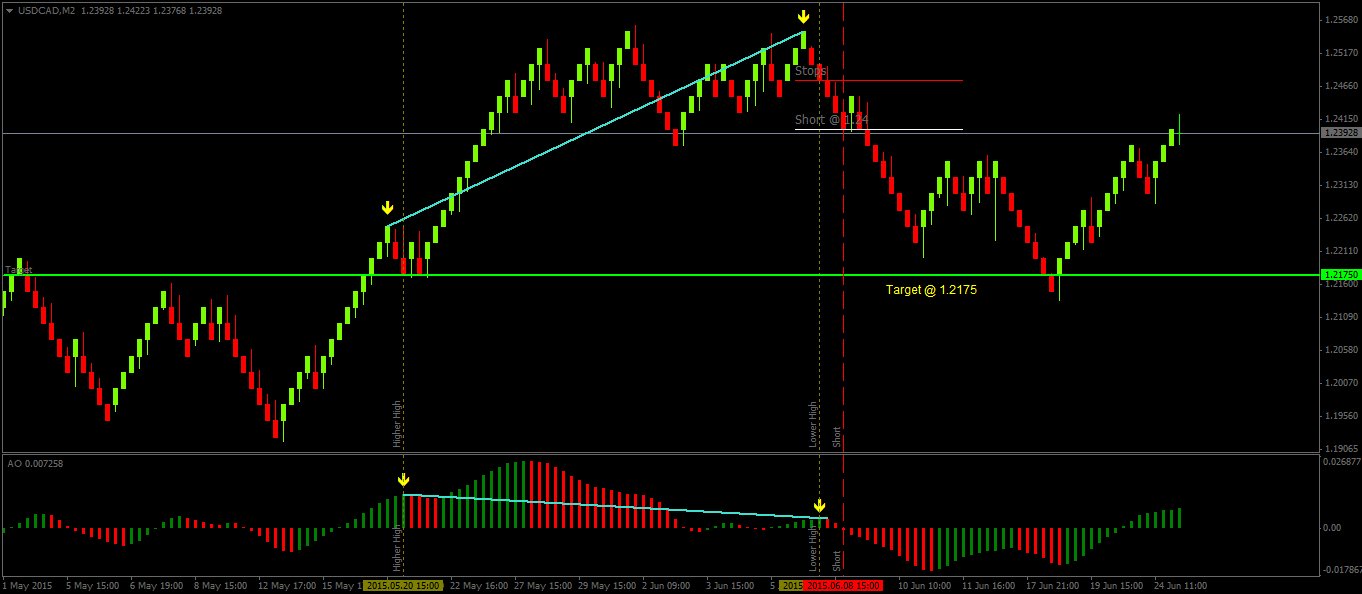
- We first notice a bearish divergence as price makes a higher high and awesome oscillator makes a lower high. The divergence is plotted with the Aqua colored line
- After the divergence is spotted, we then fine tune the price levels. The horizontal yellow lines shows the Renko candles where the AO indicated a peak
- The start of the divergence (lower high to the left) marks the target for the short set up (which is fine tuned based on the AO’s peak)
- After the AO triggers a sell signal with the histogram printing a negative bar (below 0) we enter short on the close of the candlestick. For stops, the high of the Renko candle where the divergence was spotted is used.
- Price declines and eventually hits the target at 1.2175
For Long positions we look for bullish divergence. Meaning that price makes a lower low and Awesome oscillator makes a higher low.
When this set up is spotted, for trade trigger, we wait for the Awesome oscillator print a bullish signal (histogram crosses above 0 printing a Green bar).
The chart below shows an example.
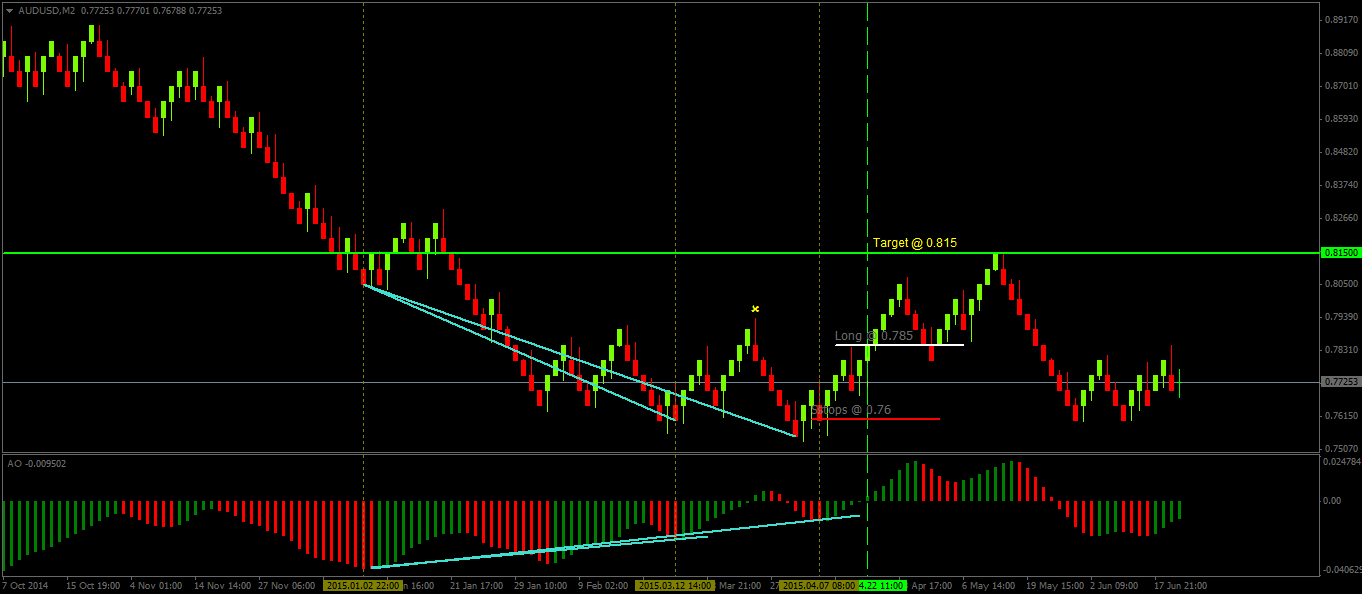
- The bullish divergence is spotted as price makes a lower low and the AO prints higher lows
- The vertical lines are used to fine tune the price levels
- After the AO gives a bullish trigger, long position is taken with the target set to the initial divergence price point
- In the above example, there is a false signal denoted by the ‘x’. This signal is ignored because when the AO gave a bullish signal, the Renko was a bearish (and engulfing the previous candlestick)
Tips for further confirmation of divergence set ups
Besides the above basic set up, traders can also include additional trade confirmations. Some of the other methods that can be used include:
- Trend line breaks
- 10/20 or 5/20 EMA crossovers
- Choosing only favorable risk/reward set ups
The Renko divergence set up with Awesome oscillator is one of the easiest trade set ups to trade and regardless of the Renko box size that is used, the above set up works. The divergence set ups are also frequently formed thus giving many trading opportunities.