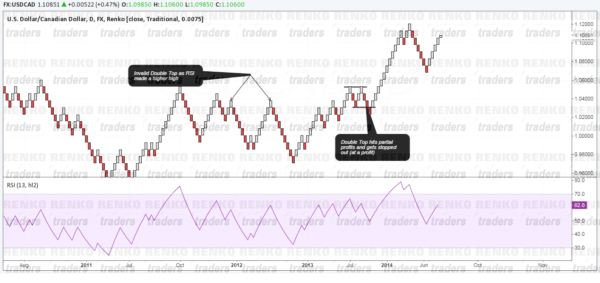
Double Tops and Double Bottom Renko chart patterns are perhaps one of the easiest of price action patterns to trade due to their simplicity without much of objectivity involved. However, not all Double Tops and Double Bottom patterns on Renko charts tend to be valid.
There are many instances when a double top or a double bottom Renko chart pattern fails miserably despite being a valid Renko price action pattern. This anomaly can however be reduced by using the Relative Strength Index Oscillator. By following a simple criterion, Renko chart traders can almost immediately filter weak double top and double bottom patterns thereby increasing the effectiveness of trading this simple recurring price action pattern on Renko charts.
In this article you will learn how to identify the double top and double bottom patterns using Renko charts and the RSI oscillator. This method can be a complete trading system in itself. So if you are looking for a safe and simple Renko trading strategy, read on.
Note that this article presents a trading system that is vastly different to the previous Renko trading strategy on Double Tops and Double Bottoms mentioned here. But this method can be combined to the previous Renko double top and double bottom price action strategy to pick more highly profitable trades.
Brief introduction to Double Top and Double Bottom Patterns
A double top pattern in the Renko chart is formed, when price tries to break previous resistance only to fail and reverse. This twice failed attempt to break resistance tells the traders that the resistance level is quite strong and therefore price is most likely to reverse lower in order to build momentum.
Similarly, the double bottom pattern in Renko charts is formed when price fails to break a previously tested support level, only to reverse and move higher. Double tops and double bottoms are a commonly recurring theme and are especially used in regular candlestick charts as well by price action traders. However, there is a bit of subjectivity involved.
Factors such as how strict the criteria should be and how much of leeway can be given for an overshoot of the previous reversal level can play a major role. Text book defined double tops and double bottom patterns are a rarity.
On the other hand, the Double Tops and Double Bottom Renko chart patterns are a common phenomenon with Renko charts and are not quite subjective as well. Therefore, the occurrence of the Renko double top and double bottom patterns are more common in a Renko chart.
Brief introduction to the Relative Strength Index and its use with Renko Charts
The RSI oscillator is a rather versatile oscillator. It is most commonly used as a tool to identify divergence to price. In other words, when the RSI fails to confirm price or when price fails to confirm RSI, a divergence is formed. This divergence points the trader to a possible short term correction of prices. The default RSI settings commonly used is the 14 period applied to close.
When price makes a higher high and RSI makes a lower high, it is indicative of a bearish price action in the short term, also known as a correction.
Likewise, when price makes a lower low and RSI makes a higher low, it is indicative of a bullish price action in the short term. These inconsistencies can therefore be exploited to find short term highly profitable trading opportunities.
Renko Double Top and Double Bottom pattern trading system
This trading system is perhaps the most simplest of all Renko trading strategies. We make use of a fixed box size Renko chart. It could be anything based on your preference; from a 20 pip to 50 pip or even higher box sizes to find long term trade opportunities.
The RSI oscillator is set to 13 periods and applied to HL/2.
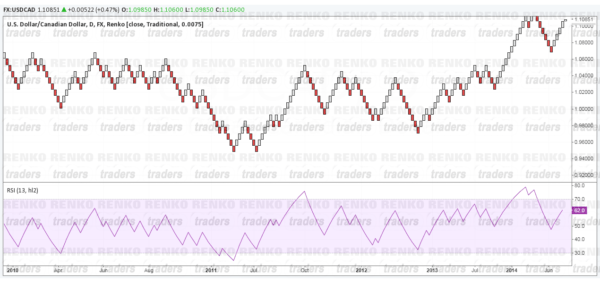
The chart below shows how your chart would look like once you have the RSI plotted.
Renko RSI – Double Top & Double Bottom Trading System Rules
Long Positions
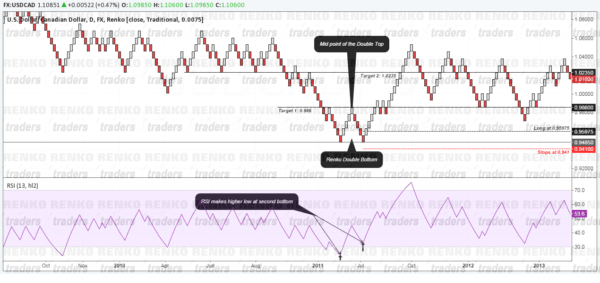
- Look for Double Bottoms to be formed on the Renko charts
- Look to the RSI to show divergence. Ideally, the RSI should plot a higher low at the second bottom
- Enter long at 50% of the Renko box size above the Renko box that showed divergence with initial target set to the mid-point of the double bottom.
- Place stops one Renko box size below the double bottom.
- Set the final target to the projected distance of the double bottom and move trade to break even or close partially after the first target is set.
Long Trade Example:
- Renko Box size is set to 50pips
- Double Bottom is formed on EURUSD at 1.3400 (high) after a reversal at 1.36
- Long at 1.3425, Stops at 1.335, Target 1: 1.36, Target 2: 1.38
Short Positions
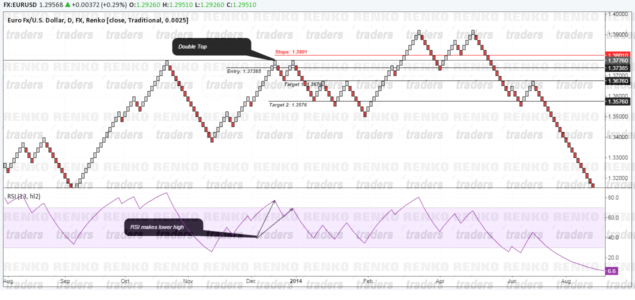
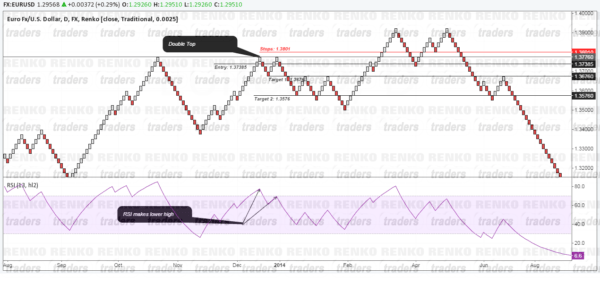
- Look for Double Tops to be formed on the Renko charts
- Look to the RSI to show divergence. The RSI should make a lower high at the second top
- Enter long at 50% of the Renko box size below the second Renko box that formed the double top with an initial target set to the mid-point of the double top
- Place stops one Renko box size above the double top
- Set the final target to the projected distance of the double top and move trader to break even or partial close after the first target is reached.
Short Trade Example:
- Renko box size is 20 Pips
- Double Top is formed in USDCAD at 1.10 (low) with a mid-point at 1.08
- Short at 1.0990, with stops at 1.1020, Target 1: 1.08, Target: 1.06
Failed Renko Double Tops and Double Bottoms
The question that might come to your mind is if this system is foolproof. Well, truth is there is no trading system that is fool proof and losses are unavoidable. Despite the Renko double top and double bottom patterns meeting all the criteria, there will still be some failed trades. Which is where money management is essential. The chart below shows some invalid and a perfectly valid trade example that failed.
RSI and Renko Double Top and Double Bottom Strategy – Other Notes
The following criteria should be kept in mind when trading with this strategy. It not only helps to increase the odds of success trading this renko trading system but also helps to filter out bad trades. Again, these criteria do not make this Renko system fool proof.
- RSI divergence difference between the lower highs and higher lows should be at least 2 or 3. Example, never trade a double top or a double bottom if the RSI shows divergence values of 68.1 and 67.5
- Failed double tops and double bottoms infer that a greater correction is taking place. Therefore do not just chuck the chart after a trade is failed. Wait for further divergence to be shown in the RSI to re-enter the set up
- Greater the RSI divergence difference, higher the probability. Refer to the chart in the Renko double top example to notice a double top pattern formed on the right. This showed a greater RSI divergence with values of 80.3 and 66.8 over a greater period of time

