The Parabolic Stop and Reverse is a rather simple trading indicator that is often used as a level to trail stops or to place pending orders. The Parabolic SAR is often a nice little indicator when prices are moving in a strong trend. You can read about other Parabolic SAR and Renko based trading strategies here.
There are many trading strategies involving the Parabolic SAR, the most common being to buy or sell when price breaks the previous Parabolic SAR. However, a quick visual back test often reveals that this rather simple method doesn’t always give good long term results.
By applying the concept of pull backs the Parabolic SAR on Renko charts can be a neat little trading system which is most ideally suited to trade on the smaller Renko box size charts such as 10, 15 or 20 and up to 30 pips. The Parabolic SAR pull backs on Renko charts offers traders a very efficient trading system with favorable risk/reward set ups.
The catch to this however is that traders need to have a lot of patience in letting go of the more ‘lucrative’ but risky trades. Also, patience is essential to this trading system as more often than not, the set ups occur not very frequently.
So if patience is something you can live with and also convince yourself to only trade the Parabolic Pull back method on Renko charts, this trading strategy will be quite interesting.
Parabolic SAR Pull back on Renko Charts – Trading Signals
Firstly, choose a Renko box size of your preference. Start with anything from 10 Pips but do not use more than 30 Pips (on major currency pairs). Another point to bear in mind that is that this Renko trading strategy works best only on major currencies as trends can be established on smaller Renko box sizes. For cross currencies price action can get very choppy.
Once the parabolic SAR is applied to the Renko chart with the default settings, we wait for the following conditions to occur.
- Price should be moving in an established trend (can be a downtrend or an uptrend)
- Wait for Price to break the most recently established Parabolic SAR with a close
- When the PSAR now starts to print new SAR levels, wait for price to pull back before taking an entry.
PSAR Renko Strategy – Buy Signal
- Previous trend should be down with at least 7 – 10 Renko boxes being printed in a downtrend and the PSAR is continuously plotting the SAR levels above price
- Wait for Price to break the previous PSAR with a close, which alerts us to a potential set up
- Now, price needs to retrace back without breaking the PSAR level which would be plotted below price
- Wait for a Renko Reversal and buy on the closing price with stops at the low
- Using the Fibonacci tool, set the level to 2 and plot the retracement
- Take profit is set to the Fib level 2 where you can exit the trade
The chart below illustrates the PSAR Pull back method for a Buy signal.

The point 1 marks the prolonged downtrend with the PSAR being plotted above price. At point 2, the downtrend is broken with price closing above the previous PSAR level. This is where we start to watch the set up. Price soon retraces within the new uptrend but doesn’t break the PSAR levels being plotted below price. At point 3, we notice a Renko reversal bar which is the set up pattern.
A long position is entered on the closing price at 0.714 with stops at the low of the Renko reversal at 0.71153. Now, using the Fib tool, connect the retracement off the low and point 2. Take profit level is derived at 0.72, where traders can exit their long position.

PSAR Renko Strategy – Sell Signal
- There should be an established previous uptrend with at least 7 – 10 Renko boxes posting the uptrend with the PSAR continuously plotting the PSAR levels below price
- Wait for price to break the most recent PSAR level with close, alerting us to a potential sell set up
- We now wait for price to retrace back while the PSAR still plots above price
- Look for a renko reversal box and sell on the closing price with stops set to the recent high
- Using the Fibonacci tool, measure the recent retracement and set the take profit level to 2
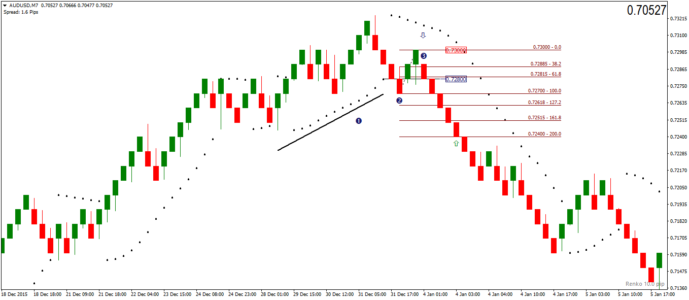
The chart below illustrates a Sell set up example using the PSAR Renko strategy.

Price was in a steady uptrend marked by point 1 with the PSAR being plotted below price. At point 2, price breaks the most recent PSAR with a close below. (Look carefully at point 2, as that Renko box marks a close and not the previous bearish close where the closing price was exactly at the previously printed PSAR level).
After point 2, price begins the retracement. With the PSAR continuing to plot above price, the retracement marks a reversal at point 3. A sell position is opened at the closing price near 0.728 with stops at the retracement high of 0.73.

Now using the Fibonacci tool, the retracement level is measured and the Take profit level is derived at 0.724.
Parabolic SAR Pull back trading on Renko Charts
As shown, the above trading strategy is relatively simple. There is ample scope for traders to further extend the profitability of this Renko trading strategy by trailing the stops to make more pips.
However, for traders who prefer to make a fixed number of pips per day or per trade instead of having to worry about trends or having to sit and watch the charts, the Parabolic SAR pull back method can be a great way to make a decent number of pips in profit.