This Renko trading strategy is a powerful method of the trading the markets with Renko charts. It combines two different approaches of trading, resulting in most cases the trader being able to capture massive pips. This Renko trading strategy however requires a lot of patience due to the distance price must travel.
The average holding period with this Renko trading strategy is easily from a few weeks to months, therefore making this a more preferable method of trading Renko charts for swing traders. The amount of time it takes to analyze the markets is merely a few minutes at most, but waiting for the set up to trigger a signal can take a lot of time.
Therefore, patience is one key essential element for this Renko trading strategy, both for waiting for the signal to be triggered as well as while the trade is open. In this article we explain how to use the Renko divergence and Trend line break trading strategy.
Renko Chart Set up – Divergence and Trend Line Break Method
For the chart set up, a fixed box size is preferred. This is to ensure that the boxes don’t move around while the trade set up is prepared on the chart and the trader waits for the trigger. Typical Renko box sizes are 0.0025, 0.005 for non Yen pairs and 0.25 or 0.5 for Yen crosses.
The Renko box size can be moved around in an effort to find the best box size that can show a long term trend in the currency pairs.
Once the preferred Renko box size is configured, the next step is to identify a trend and draw the trend lines accordingly. Up trends are identified by higher highs and down trends are identified by lower lows. While plotting the trend line, there must be two contact points with the trend lines (i.e: two lower highs must touch the trend line or two higher lows must touch the trend line).
In the event that any of the highs or lows break the trend line, re-adjust the trend line so that at no point do you see any Renko bricks breaking the trend line only to retrace above (or below) the trend lines.
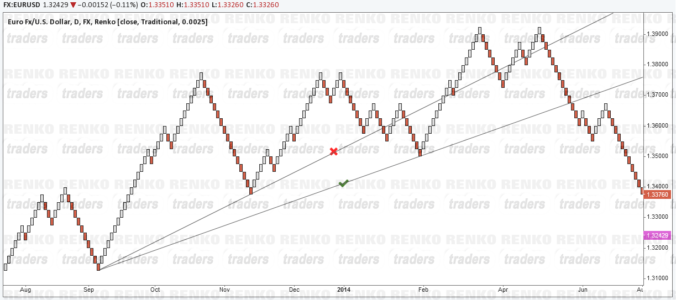
The chart below show the right way and the wrong way of plotting trend lines with this trade set up.

Divergence and Trend Line Break Method – Renko Trading System
This Renko trading method makes use of two different approaches to analyzing the markets. Let’s take a look at each of these in brief detail.
What is Divergence?
Divergence is an anomaly between price and the oscillator. When price makes a higher high, the Oscillator is expected to plot higher highs as well. Or when price makes a lower low, the Oscillator is also expected to plot a lower low. The absence of this uniformity between price and the Oscillator is what gives rise to divergence.
There are 4 types of divergences but to keep it in context; we will refer to only a few divergence methods applicable for this Renko trading method.
Divergence within an uptrend
Price: Higher Low | Oscillator: Lower Low = Trigger to sell
Additional Confirmation
Price: Higher High | Oscillator: Lower High = Confirmation to sell
Divergence within a downtrend
Price: Lower High | Oscillator: Higher High = Trigger to buy
Additional Confirmation
Price: Lower Low | Oscillator: Higher Low = Confirmation to buy
What is the trend line break method?
The trend line break method is borrowed from the famous Mouteki trend line trading method. There are many resources on forums and elsewhere about this method so we won’t go into the details of this method. The only thing to remember is that this trend line break method forms the major structure of the chart set up.
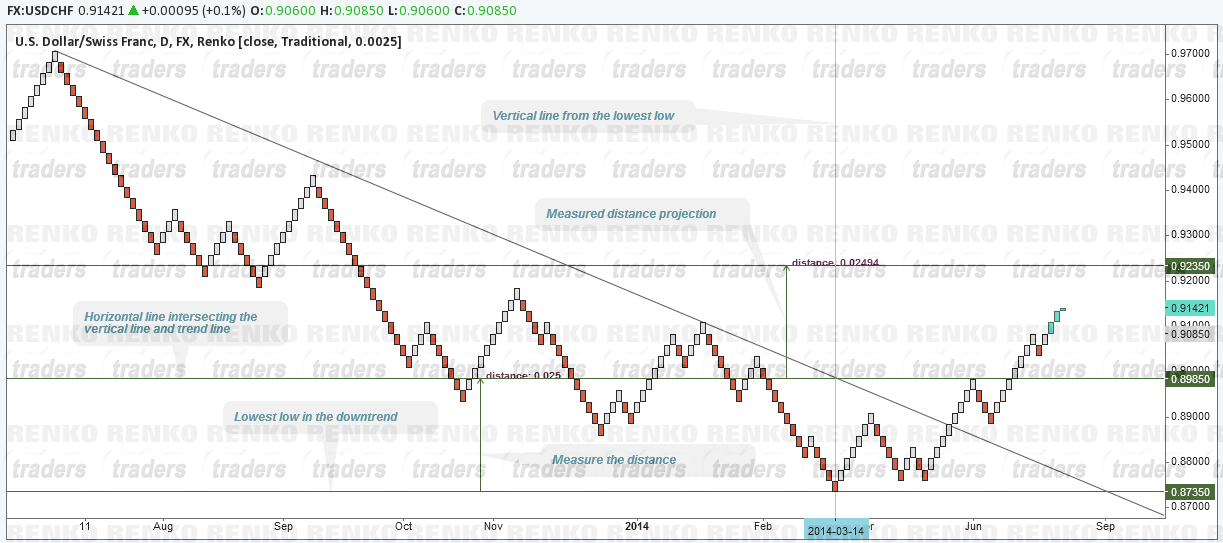
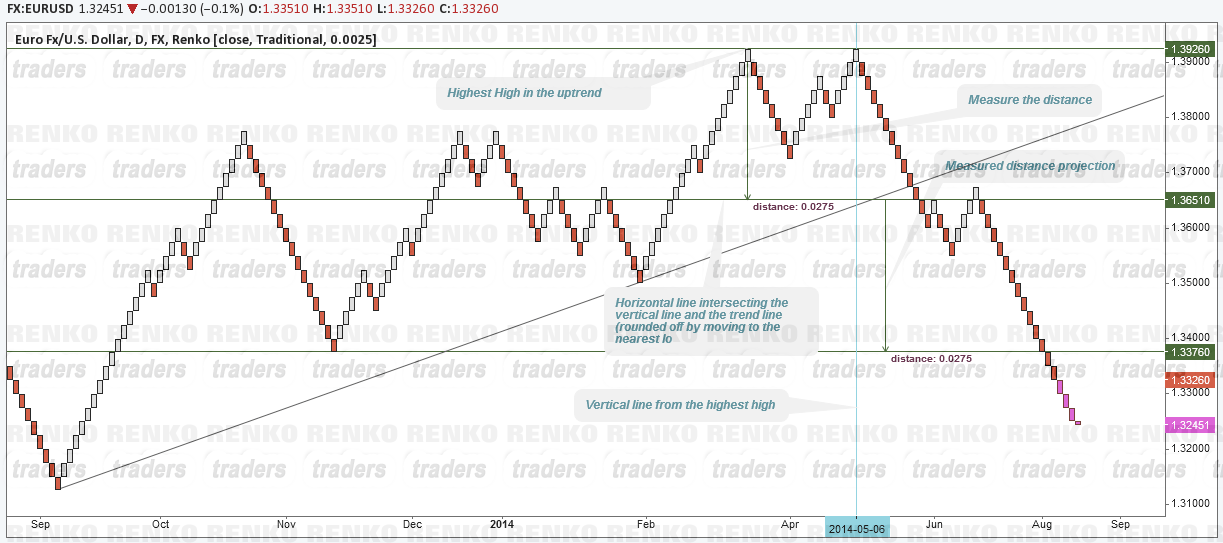
By plotting a trend line connecting two lows, place a horizontal line at the highest price during the uptrend. Plot a vertical line from this highest price (Renko box) and place another horizontal line that cuts through the intersection of the vertical line and the trend line.
Calculate the distance between the highest price and the second horizontal line and project this distance from the second horizontal line (to the downside in case of an uptrend or to the up side is case of a downtrend).
The charts below illustrate this trend line break structure.
Renko Trading System (Renko DTL Method) – Triggers
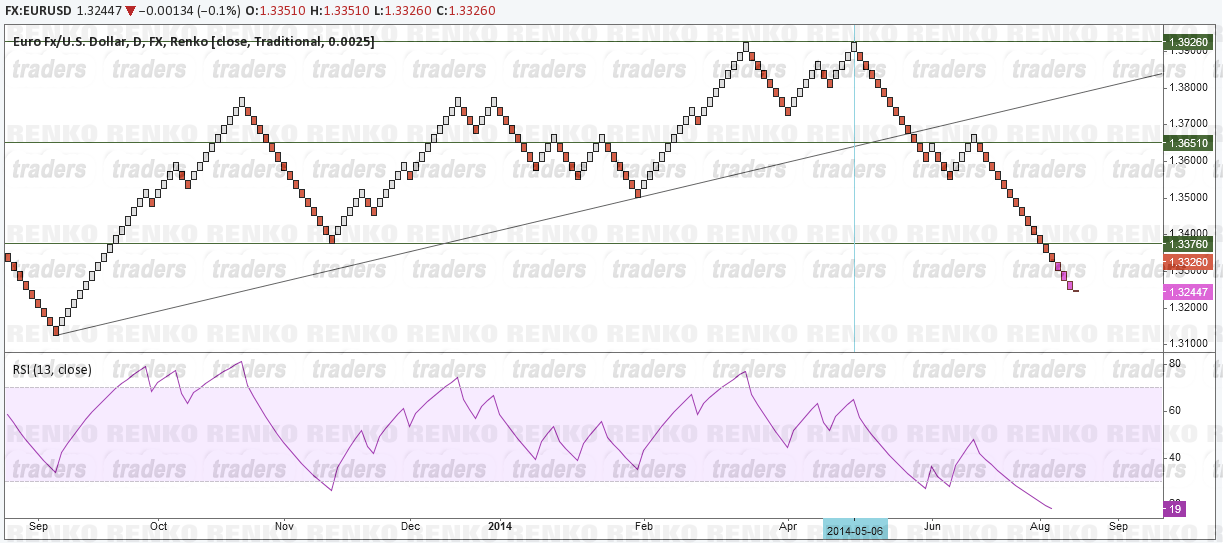
Now that we have the chart set up ready, the final piece to the puzzle is to use the RSI (13) indicator. This oscillator is used to identify divergences. The Renko trading system, Divergence and Trend line break method final charts should look like this.
Once the chart set up is complete, the following rules dictate the triggers for entering and exiting trades.
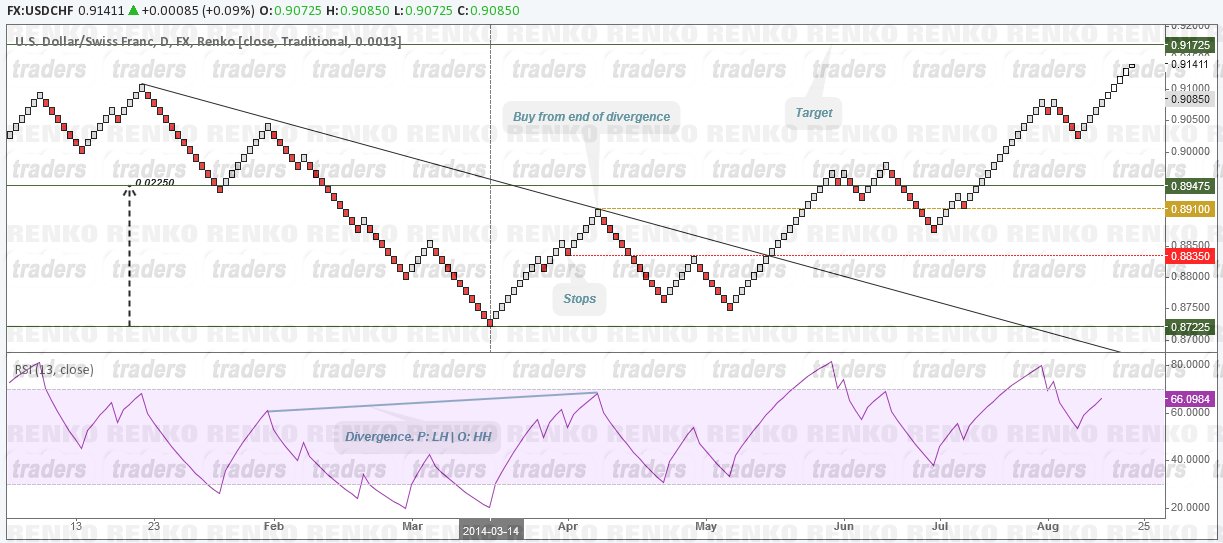
Renko DTL Method – Buy Triggers
- Price must be in a downtrend with the trend line connecting two lower highs
- Using the trend line break method described above, plot the two horizontal lines, the vertical lines and project the distance to the upside
- Wait for Renko boxes to break the trend line
- Look for any of the divergence patterns mentioned earlier in this article
- From the end point of the divergence, buy targeting the projected move and stops at the nearest support/resistance level
Example:
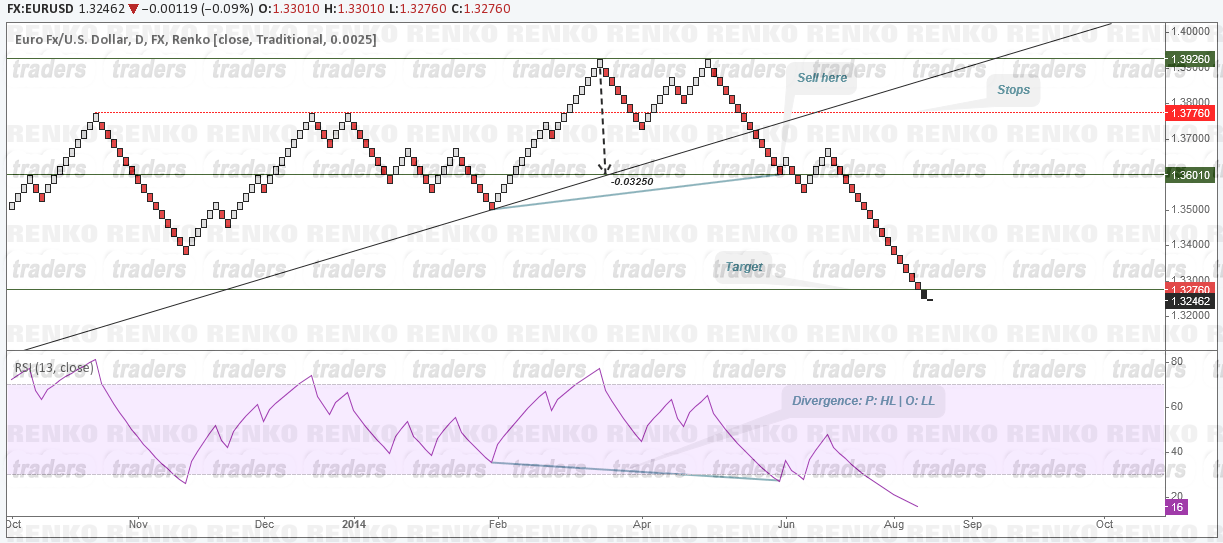
Renko DTL Method – Sell Triggers
- Price must be in a uptrend with the trend line connecting two lower lows
- Using the trend line break method described above, plot the two horizontal lines, the vertical lines and project the distance to the upside
- Wait for Renko boxes to break the trend line
- Look for any of the divergence patterns mentioned earlier in this article
- From the end point of the divergence, sell targeting the projected move and stops at the nearest support/resistance level
Example:
Renko Divergence and Trend Line Break Method – Conclusion
This Renko trading strategy is very powerful and the chart set up basically combines the elements of trend reversals. With due practice and especially a lot of patience, this Renko trading strategy can deliver amazing results. Within the structure of the trend lines and divergence confirmations, traders can also look for Renko chart patterns to increase their exposure and profit from the massive moves that this renko trading system can offer.