
If you want to trade indices on MT4 with renko charts, then this is a must read guide. Trading indices on MT4 is not just about building renko charts and hitting the buy/sell buttons.
No matter how strong your trading strategy is, you need to be adept at both the financial and technical aspects. This is where trading indices on MT4 can differ quite a bit.
This exhaustive guide on how to trade indices on MT4 using renko charts lays the groundwork on the basics of index trading. As we progress in this article, you will learn the various aspects needed to be successful in trading indices on MT4.
What are stock indexes or indices?
A stock index is a benchmark index that comprises of various individual stocks.
The individual stocks are then weighted (either by the market cap) or price weighted and converted to an index value.
The stock index, as a result gives a snapshot at any time on how a basket of individual stocks are performing. When a stock index rises, it doesn’t specifically mean that all the individual stocks are rising.
This comes down to how the stock index is calculated.
To learn more about this, we need to know what are the different types of weightages that are available. A stock index can be classified into the following types.
- Price weighted index
- Market cap weighted index
- Equal weighted index
What is a price weighted index?
A price weighted index is where every individual stock is weighted according to its share price. Thus, individual stocks with higher share price have a greater weight. Likewise, individual stocks with lower or smaller share price are given less weightage.
In doing so, companies that have a higher share price are given more weight comparing to companies with lower share price.
Examples of price weighted indexes are the Dow Jones Industrial Average, or the Nikkei 225 index.
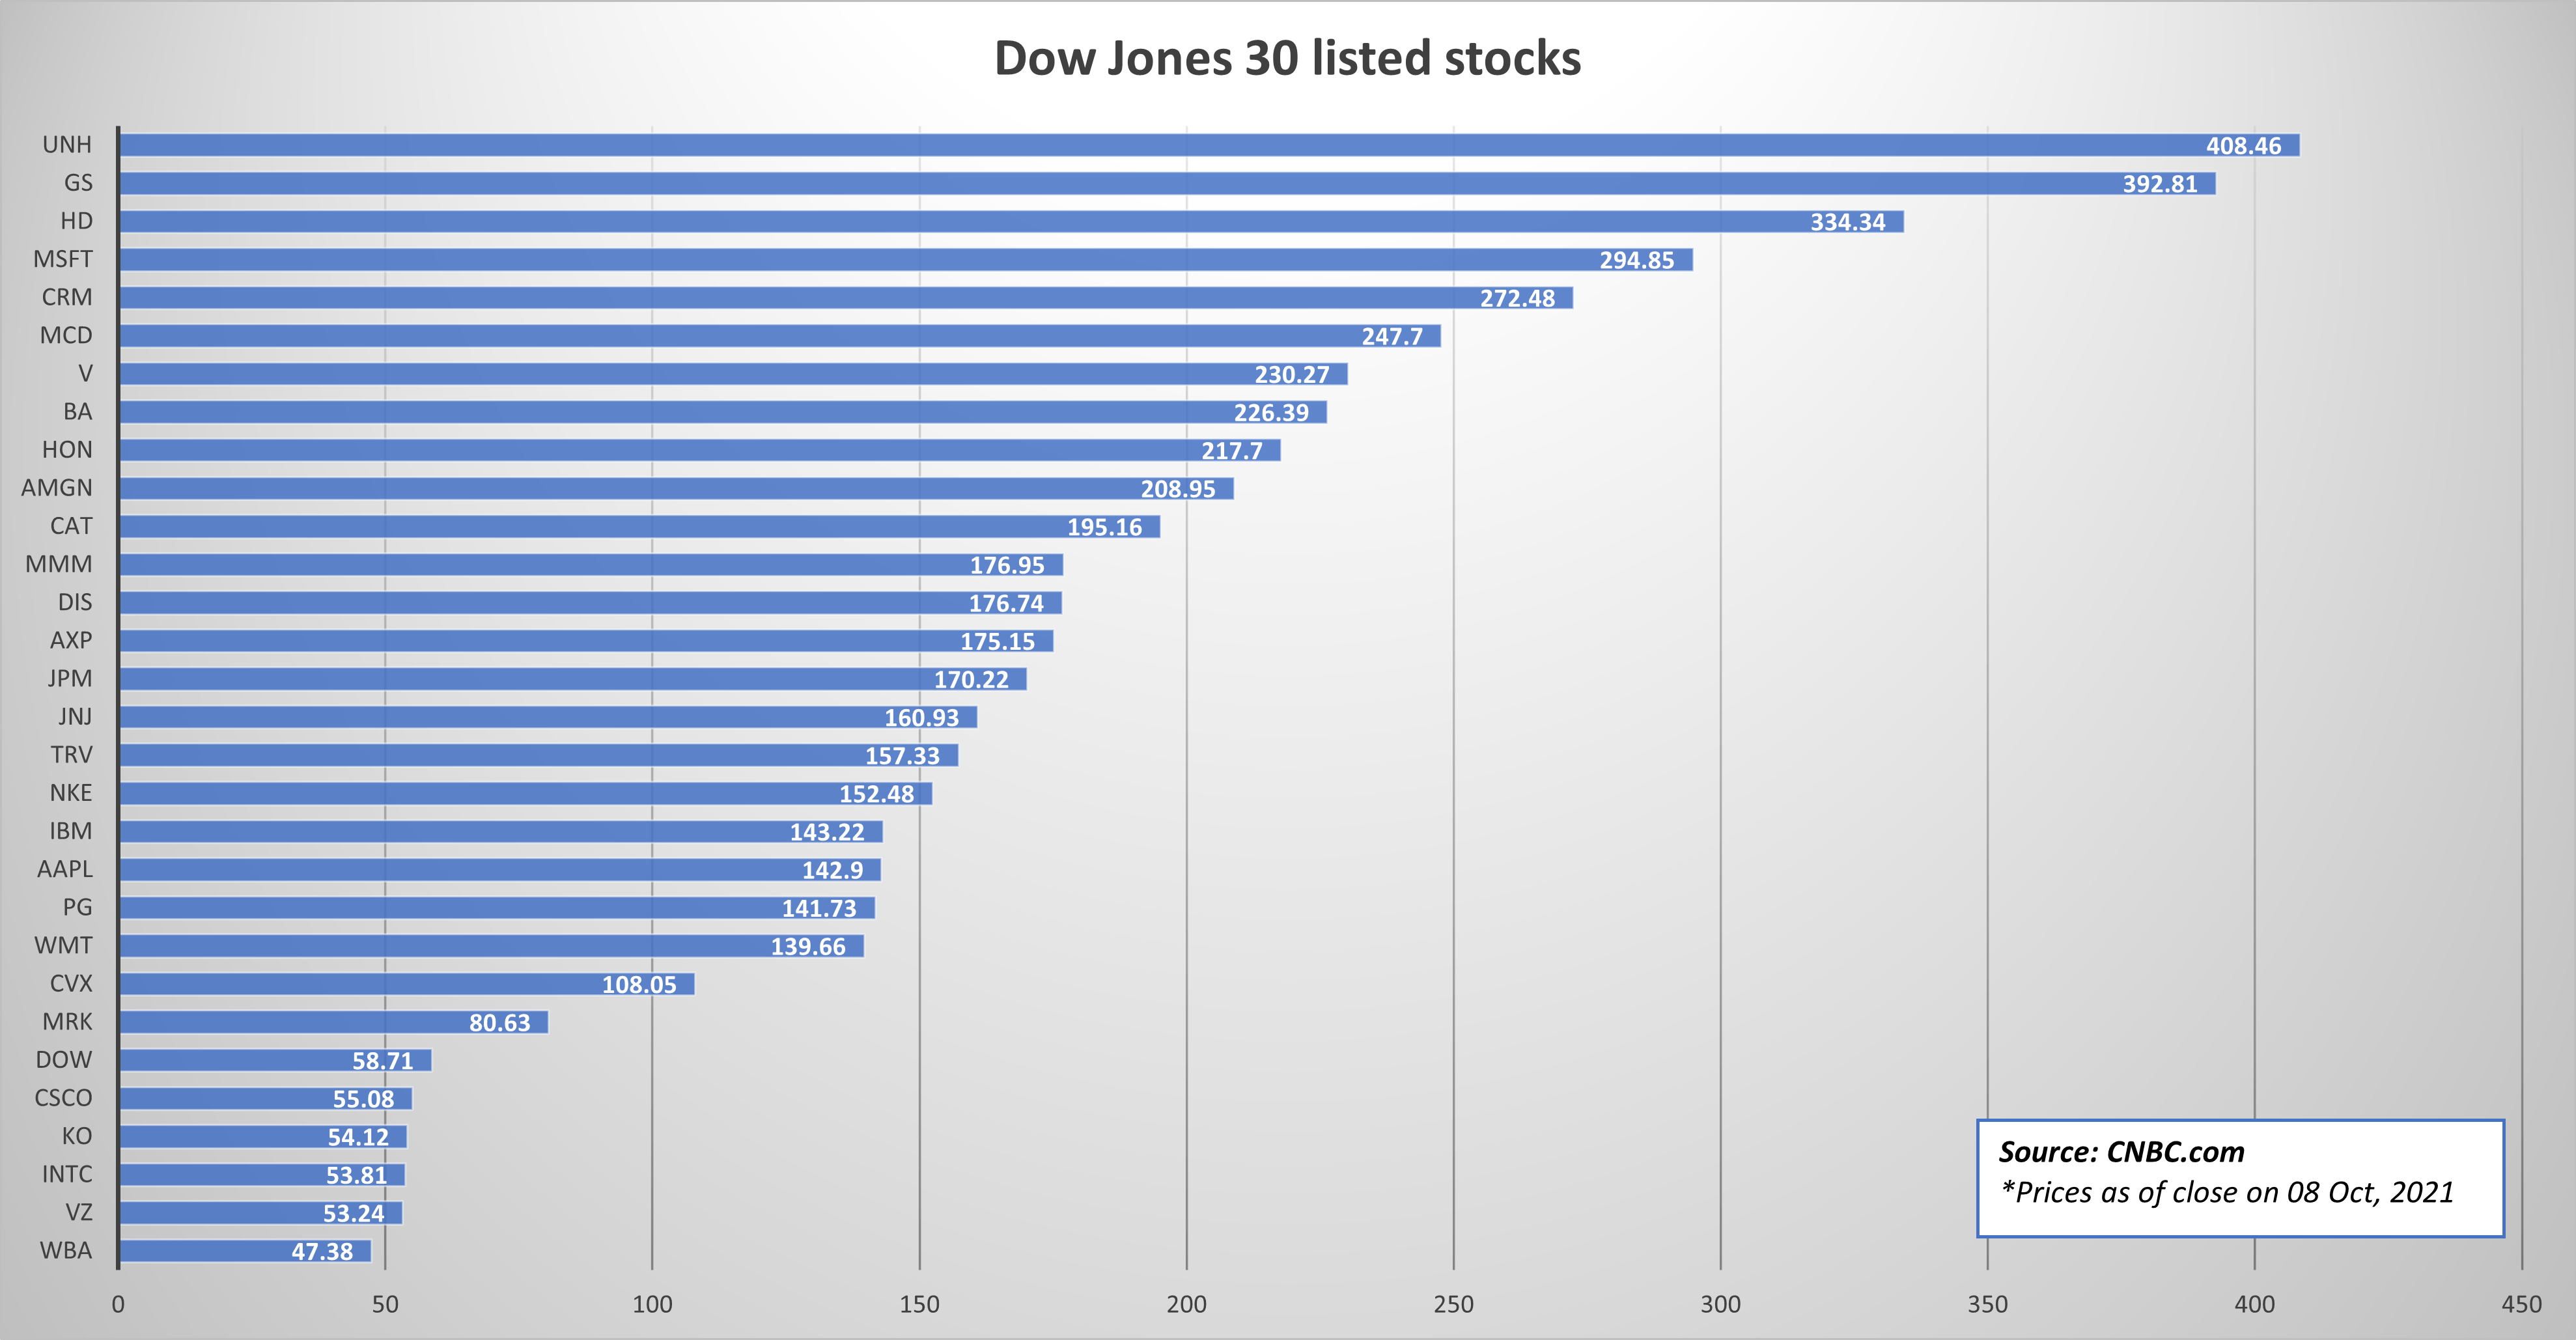
To elaborate further, let’s look at the Dow Jones index. If you sort the underlying 30 companies by price, then the top five individual stocks are at the time of writing:
- UnitedHealth Group Inc (UNH)
- Goldman Sachs Group Inc. (GS)
- Home Depot Inc (HD)
- Microsoft Corp. (MSFT)
- com (CRM)
Meanwhile, making up the tail end of the Dow Jones index are:
- Walgreens Boots Alliance Inc (WBA)
- Verizon Communication Inc. (VZ)
- Intel Corp (INTC)
- Coca-Cola Co. (KO)
- Cisco Systems (CSCO)
What is a market cap weighted index?
As the name suggests, a market cap weighted index is where, the weighting is based on the total market capitalization of the company.
The only difference with price weighted index is that a market cap weighted index assigns higher weights to companies who boast of a higher market cap. In doing so, a stock index using this weightage tends to account for the broader market share.
The stock price is irrelevant in this type of stock index weighting.
Examples of market cap weighted stock indices are the S&P500, NASDAQ, FTSE100.
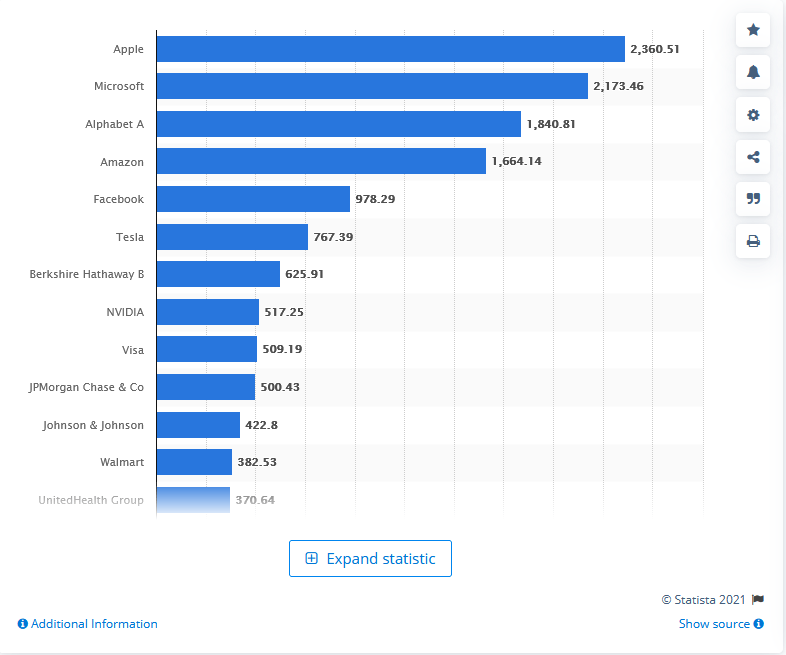
The above chart shows the top companies in the S&P500 index by market cap.
Notice how Microsoft ranks at number two. But if you look to the Dow Jones index, Microsoft takes the fourth position. One reason for this is that Microsoft is indexed both on the Dow Jones and the S&P500.
Whereas companies such as Apple Inc. or Alphabet are not in the Dow Jones index. If this were to happen, then clearly, Alphabet would take the top spot in the Dow Jones index.
Equal weighted index
An equal weighted stock index comprises of a select list of underlying stocks. In such an index, all the underlying stocks are given the same weight.
Of course, the criteria to be included into the index begins with a minimum requirement such as market cap, and so on. In an equal weighted index, no one underlying stock has a higher chance to influence than the other.
Examples of the equal weighted stock index is the Europe STOXX 600. This stock index is made up of various regional stocks across the UK, Switzerland and mainland Europe.
What is Stock index CFD trading?
Firstly, you cannot buy a stock index outright.
As the name suggest, an index is merely a benchmark. What you can do is buy the stock index via derivatives. The most commonly used derivatives to trade stock indices are the index futures.
You also have the choice to trade these stock indices via options and through CFDs as well.
CFDs or contracts for differences are derivatives of the underlying asset. If you want to speculate on the price movement for an asset, a CFD contract allows you to do that.
Thus, many forex brokers offer stock index CFD trading. This gives you the trader, a chance to speculate on the prices of the stock indices.
Through a stock index CFD, you are also able to go long and short on the index.
The price of the stock indices CFD reflects the underlying index prices. Depending on the forex broker that you trade with, these stock index CFD prices can differ slightly. This is because the forex broker also adds a mark up on the bid and ask prices.
When you trade a stock index CFD, you do not own the underlying stocks and neither do you own the underlying index. You can only speculate and thus make a profit or loss from the stock index CFD.
What is the best time to trade indices?
Various countries have their own benchmark indices.
In the United States, the biggest stock indices are:
- Dow Jones 30
- S&P500 Index
- NASDAQ 100
Meanwhile, if you step across the pond, in Europe, you have regional stock indices as well as a supra-national stock indices.
The Euro STOXX 600 is an example of a supra-national index because it comprises of stocks not just from Europe but also from the UK.
And if you continue to go east, you will find various regional benchmark indices. The Nikkei 225 is the leading benchmark index for Japan. In Hong Kong, you have the Hang Seng index, and the South Korean KOPSI index.
In India, you have the NIFTY50 index as well the BSE Sensex index. Each of these stock indices have their own compositions, in terms of the number of companies they list. Secondly, the weighting can also change.
Thus, if you ask the question what is the best time to trade indices, the answer depends on what stock indices you want trade!
If you want to trade the S&P500 index, it is more liquid. Hence, you can trade the S&P500 CFD index during off-US trading sessions. But on the other hand, a regional stock index such as the NIFTY50 will be illiquid as it is a regional index for India.
Therefore, to consider the best time to trade indices, you need to account for the index that you want to trade. You should also take into consideration if this stock index CFD is offered by your forex broker.
Last but not the least, take into account the liquidity factor. U.S. stock indices are very liquid and thus can be traded any time. Whereas a regional stock index is not liquid after its regional business hours.
Why trade indices on MT4?
Trading indices on MT4 platform is obviously easy for a number of reasons. Firstly, since it is a derivative product, you don’t have to do too much. Trading indices on MT4 is lot easier and you only need to drag and drop the indices to your MT4 charts.
Secondly, since these indices on MT4 are CFD contracts, you can trade long and short without any additional capital requirements.
Stock index CFDs on MT4 are leveraged. Thus, with just a small amount of capital, you can trade on these indices on MT4.
And obviously, these instruments are on the same platform. Hence, you can apply technical trading strategies, including using Renko charts on such instruments.
Due to the nature of these instruments, trading stock indices on MT4 can be done by day traders as well. Hence, you can capitalize on the short term price fluctuations in these indices.
What are the different stock index CFDs available on MT4?
Depending on the forex broker you choose, the number and choice of stock indices can vary.
In many cases, the forex broker will obviously offer stock indices on MT4 such as the Dow Jones, S&P500 and the FTSE100.
But there are some forex brokers that offer additional indices on MT4 such as the Nikkei 225, various other indices such as the Russell 2000, Australia’s ASX 200 index and many more.
You should check on your MT4 trading platform by clicking on the symbols window. Alternately, if you do not have a forex broker account yet, you can research into them.
Find a forex broker that offers a good choice of various stock index CFDs. If you are very specific about gaining access to a particular forex broker that offers a specific stock index, then google them. There are quite a few websites that allow you to filter for a forex broker based on the instruments that you want to trade.
How do stock indices work on MT4?
Stock indices on MT4 behave like normal instruments such as forex.
Firstly, these stock indices are available for trading 5 days a week. Depending on the index you choose, you may or may not be able to place a trade. This is true if the stock index belongs to a region.
You can find more details of the trading hours by right-clicking on the symbol and selecting properties.
This specifications window will show you the trading hours for that index in question.
A major difference with trading stock indices on MT4 is obviously leverage. And with leverage, you have additional factors to bear in mind.
Swap fees or rollover fees matter when trading indices on MT4
The most important of all is the swap or the overnight financing costs. No matter whether you are long or short, you will have to pay an overnight swap fee.
Seasoned forex traders will know that especially on Wednesdays, you have a triple rollover. The triple rollover ensures to account for weekends as well.
Hence, if your trading strategy is to hold the trade for a few days, then these overnight swap fees can eat into your profits.
The swap fees are denoted in points. The points indicate the total fees you will pay for trading one standard lot.
Therefore, if the swap points show -31.415 for swap long and -29.232 for swap short, then for a standard lot size, this is the overnight fee you will pay.
Thus, if you hold your trade open overnight from one Monday to the next, that is a total of five business days or one calendar week. If you were long with one standard lot, your weekly cost will be close to $220.
Breaking this down, for a mini-lot position your weekly cost comes to $22 and so on.
Note that the swap fee changes from one broker to another.
Dividend payouts on stock indices in MT4
Interestingly, if you have a long position on a stock index, around the dividend payout periods, these are added or credited to your account.
Of course, if you happen to have a short position, the dividend amounts are debited from your account. (You can think of this as an additional cost of trading indices on MT4).
Depending on the stock index you trade, the dividends may vary. For example, the S&P500 pays out quarterly dividends. You can visit this link to read more about the S&P50 dividend history.
While dividends are a completely different story, we will only mention that if you are long on the stock index, and if that index pays out dividends, then you get those dividends as well.
To check if a stock index pays dividends or not, you should visit the respective stock index factsheet to learn more.
The S&P500 for example set an annual dividend of $3.08, paid out quarterly, which comes to around 0.77. Thus, if you have a long position around the Dividend Pay Date, then you get paid this amount.
Index trading for beginners
As a beginner, if you are interested to trade stock indices on MT4, then you need to first understand the basics of these indices.
Unlike forex, where there are quite some similarities between the currency pairs, with stock indices on MT4, it is different.
Each stock index tends to have its own characteristics.
Factors such as dividend payments, quarterly futures expiration and so on play a big role in influencing the price of the stock index. Thus, it is in your best interest to understand the basics of the stock indices before you even start trading them.
Once you have the basics in place, the next step is to pick a liquid index. You can choose any of the major US stock indices as these are the most liquid.
Paper trading or demo trading on these stock indices can help you to get familiar with the price action.
This is when you can start applying your technical trading strategies or even start using custom charts. Since you can go long and short trading stock indices on MT4, there can be a temptation. Risk management is essential when it comes to trading stock indices on MT4.
Due to the tick value, if you choose an inappropriate lot size, you can end up losing all your capital.
This leads us to another aspect. As a beginner, before you trade stock indices, get to know the details such as the tick size, tick value and so on.
You can find all this information by clicking on the symbol and selecting the specifications option.
Trade indices with renko charts
Trading indices with renko charts on MT4 is relatively simple. If you have been following this renko trading blog, you are already familiar with the concepts.
To trade indices with renko charts you will need the following:
- A forex broker that offers indices trading on MT4
- The MT4 renko indicator, which you can download from this website
- Renko trading strategies that you can apply straight away for demo trading to begin with
I highly recommend that you spend a few days to a month demo trading CFD indices on MT4 with renko charts.
This will allow you to customize the renko chart settings as well get familiar with the brick size. As mentioned earlier, the tick size for CFD indices can be quite big.
Hence, you need to thoroughly test out indices CFD trading with renko charts on a demo account.
How to choose renko box size for stock indices?
Choosing the renko box size for CFD indices takes a bit more work.
If you think you can pick a random box size and get away with it, you will end up paying for this mistake. In this section, we take a look at an objective way to pick the renko box size for trading CFD indices on MT4.
To choose the right renko box size to trade indices on MT4, you need to start with your trading capital.
Calculating your risk
Let’s assume that your trading capital is $10,000.
The next step is to find out the contract specifications. Let’s work it out based on the below information.
The maximum contract or the volume is 10. This means if you open a 1 standard lot, then you will in effect have 10 units of the S&P500.
Or, if you open a trade in the S&P500 index using 0.10 lots, then you will have 1 unit of the S&P500 index.
The tick value is $10, with a tick size of 0.1.
Thus, if the S&P500 index CFD moves from 4300 to 4301, then, with a standard lot size for a long position it would be 100 ticks.
Multiplying the tick value with tick size, a full one point move will translate to $100 for a standard lot or $10 for a mini-lot.
Choosing the tick size for renko
Based on this, you now know the tick value and also the lot size you will trade, which will be 0.10 lots.
Now comes the part about choosing the renko box size to trade indices on MT4. In this case, if you choose a renko box size of 1 point (or 100 ticks), you can do the math.
A full one point move will cost you + or – $10, depending on whether you are long or short.
But you cannot choose a 1 point or 100 tick as the renko box size. This is because if you look at the daily 14-day ATR for the S&P500 stock index, it comes to around 45. Thus, a renko box size of 45 will mean that your box size will be 45 points large.
Translating this to ticks, that is 4500 ticks, which can be a great recipe for disaster of losing all your money.
And neither can you set up the renko chart to use 1 tick as this would result in a lot of noise. The trick is to find a balance between the renko box size for CFD indices and the amount of money you want to risk.
Thus, if you are going to rise 1% of your trading capital, which comes to $100, then you could look at a renko box size between 1 – 2.5 points or about 100 – 250 ticks.
Finding the right base chart for renko
And finally, you should now adjust the base chart time frame. Obviously, if you use a 250 tick or 2.5 point renko box size on a daily chart, you will see a lot of bullish and bearish renko bricks.
Thus, switching to a smaller time frame will eliminate these strong movements. It will also help to reduce the wick sizes. Read the importance of base chart timeframe when using renko brickss.
The below two renko charts show the 2.5 point S&P500 index but using a 5-minute chart and a 4-hour chart as the base chart time frame.
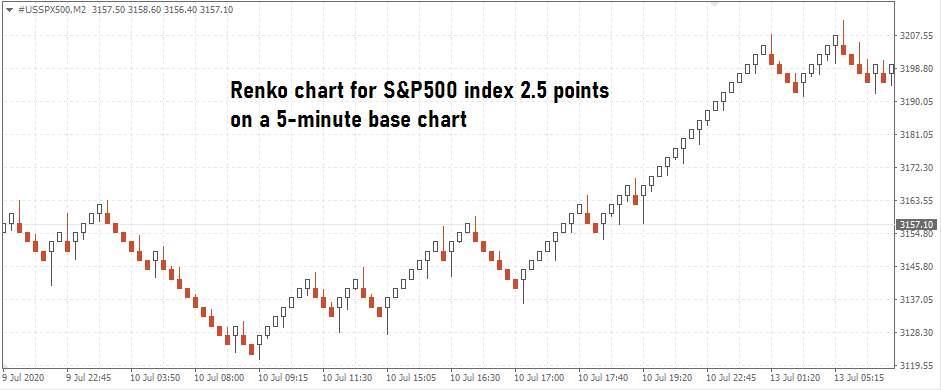
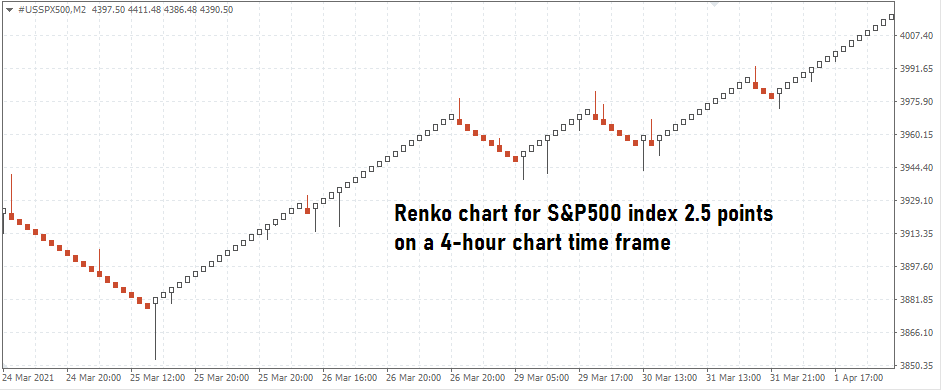
You can see the difference. The second chart is not quite good for trading given its strong price movements and larger wicks.
Overall, your renko brick size should be within the range of 1 – 5 points.
You can of course build another renko chart with a 10 or 25 point to understand what is happening on the larger renko brick size timeframe.
What renko strategies to use for trading stock indices?
There are different ways you can trade indices with renko charts. The easiest would be to scalp the market.
This is when you need to use smaller renko brick sizes. Once you have these renko charts for indices, you can then use any of the short term trading strategies for renko that are outlined. On the other hand, if you want to swing trade indices using renko charts, you should use a slightly higher renko brick size.
The downside is that your risk will increase. But at the same time, you would be able to take up a position spanning a few days to a few weeks.
Due to the volatile nature of the stock indices, you should also pay attention to the fundamentals. It can be easy for the day trader to get fully engrossed into trading with technical analysis only.
Pros and cons of trading indices?
The pros and cons of trading indices on MT4 depends on the trader’s goals. If you like equities in general and find it easier to understand than forex, then indices of course make a good choice.
On the other hand, if you are looking to diversify from forex, even in this aspect, stock indices are a good play.
There will be some common factors however that will influence both forex and indices. For example, monetary policy is one big theme playing out these days.
Therefore, Fed speeches can play a big role in shaping the volatility, whether you are trading indices or forex on MT4.
At the end of the day, no financial instrument is risk free. Depending on what asset you choose, the risks may differ. Traders need to pay attention to these characteristics before deciding if they want to trade indices on MT4.