Squeeze plays is a very common strategy often employed with stocks. Squeeze play makes use of the Bollinger Bands and Keltner channels and is based on the premise that when Bollinger Bands are squeezed inside the Keltner channels, they indicate a volatile break out.
Squeeze plays are often used to capture these high momentum and volatile break outs.
The problem with Squeeze plays however is the fact that when used on traditional candlesticks, the break out can be hard to capture unless a trader takes into account the candlestick patterns and support/resistance levels or other indicators such as an oscillator.
Making use of all these methods could result in either mis-timed trades or entering in a completely wrong side of the trade. After all, when you are trading with volatility, too tight a stop loss or too wide a stop loss can both be disastrous.
Introducing Renko based Squeeze Plays
One of the foremost advantages of using the Sqeeuze play on Renko charts is undoubtedly the nature of the Renko Charts themselves. One simply needs to look at the chart to get an idea of how price action is forming and also be able to understand the prevailing trend.
This automatically reduces the number of losing trades.
The only issue with using the Squeeze play strategy with Renko charts is that there is no “one-size-fits-all” type of setting for configuring the Bollinger Bands and Keltner Channels. This means that traders will have to adjust their indicators first with a bit of visual backtesting (i.e: look for the squeeze play pattern on previous bricks).
Regardless, this little bit of effort will definitely result in capturing some great trades.
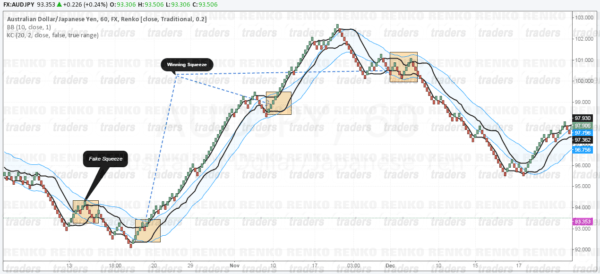
Here is a sample AUDJPY chart with the Squeeze play set up.
The highlighted rectangles shows the periods when the Bollinger Bands squeezed into the Keltner Channels. On the chart we can see one false break out followed by three very successful squeeze plays.
How to trade the Renko Squeeze Plays?
Trading the Renko Squeeze play set up is very simple.
- Wait for Bollinger Bands to squeeze into the Keltner Channel
- Based on your analysis you can either enter long or short, or if in doubt, wait until the first brick is formed where one of the Bollinger Bands (upper or lower band) break out of the Keltner Channel)
- Depending on the direction of the break out enter long or short and place your stops at the most recent high or low prior to the break out
- As always, with money management, ensure that you close part of your positions are regular intervals while trailing stops to the lower Bollinger bands all the way until you get stopped out
- There will be losers no doubt, but with enough practice you should be able to see a net aggregate winners using this strategy
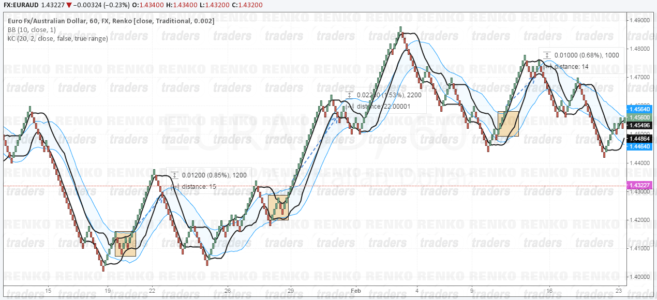
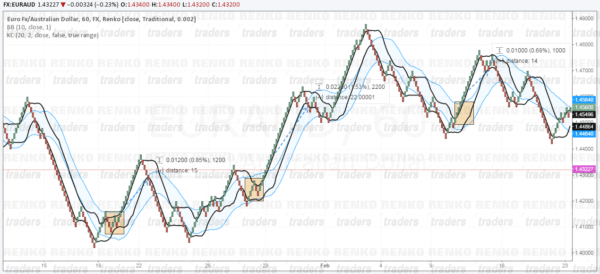
The chart below shows some random examples:
The chart above was randomly picked and if you notice there wasn’t any adjustments made to the Bollinger Bands or even the Keltner channels. The long positions shown on the charts is a mechanical following of the rules and in each of the three instances, resulted in profits of 120, 220 and 100 pips respectively, while all the time the stops were limited to no more than 40 pips at the maximum..
Drawbacks of the Renko Squeeze Play Strategy
While the Squeeze play strategy might get you excited, there are some drawbacks to keep in mind.
Firstly, when using the above set up on your MT4 charts using any of the Renko indicators that are freely floating, the charts might seem very cluttered. While this might not seem much, once you put them on, you will notice that it can get really confusing, and in the heat of the moment, when the markets are running you will be prone to making silly mistakes.
While the above example has been shown using Tradingview.com charts, the biggest factor with these Renko charts is that the bricks are ‘closed‘ or ‘printed‘ only on the candle close above the Renko box size. This results in losing out on some valuable pips. Those who trade volatility would know that some times price can just rocket leaving you dazed. The worst mistake you can make at this time is to enter at market during volatility Not only will your stop loss be far away, your take profits could also reduce quite a bit
But don’t let the above scare you much. If you have a good background in price action trading, a few horizontal support/resistance lines or combined with divergence should help give you early clues into what the market could do next.


