This analysis of AUDCAD Renko charts is a delayed analysis. Subscribers to our newsletter received the trade signal details few days ago.
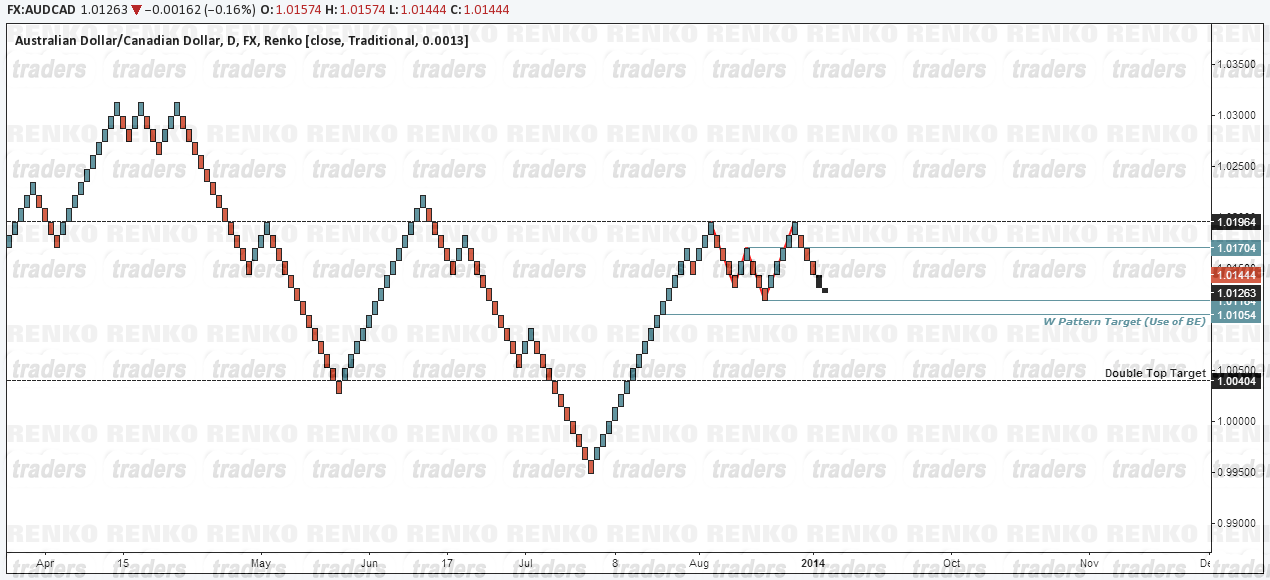
The AUDCAD Renko chart has a lot of bearish signs, starting with the “W” pattern followed by a double top. The “W” pattern gives a minimum target of 1.01054 while the double top pattern targets 1.00404.
In view of these two patterns, trades can be moved to break even or book partial profits when the “W” pattern’s minimum target is reached, while leaving the rest of the trade open to target the double top pattern’s target.