The “W” and “M” are two commonly occurring Renko chart patterns and are indicative of a corrective move. They occur usually at the top of the uptrend and at the bottom of a downtrend; either long term trend or intermediary trend.
The success factor for trading the “W” and “M” Renko chart patterns is relatively easy to spot and is in fact more reliable than traditional chart patterns such as Head and Shoulders or even double tops and bottoms. These patterns fall under the price action trading category and therefore does not use any indicators.
This article describes how traders can trade the “W” pattern and also the different variations of these highly reliable reversal patterns. In a later article, we will describe in detail about trading the “M” pattern.
Identifying the W Pattern with Renko Charts
The “W” pattern comes in various forms, but here are two variations.
- “W” pattern with a double bottom
- “W” pattern with the right bottom being lower than the previous bottom
For a “W” pattern to be qualified for trading, look for the following characteristics.
- The Renko charts must be in an uptrend. If in doubt, simply eyeball the chart and see how price is moving. If it is moving from bottom left to top right, it is an uptrend
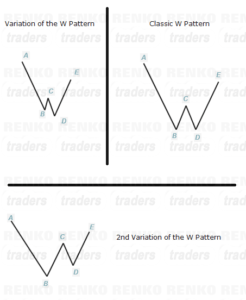
- For the sake of this article, we will classify “W” patterns into A, B, C, D and E; where A and E are the two main peaks, B and D are the two main troughs and C is the middle peak
- E must always make a lower high than A
- C must always make a lower high than A and E
- B and D can either be double bottom or D can make a lower low, but not more than 1 Renko brick
- D can be higher than B but not more than 1 Renko brick
- A and E or C & D must never form a double top as it reduces the reliability of this pattern
The following image gives a visual description of the “Classic W” pattern and the two variations.

Trading the “W” Pattern with Renko Charts
The “W” pattern is indicative of a corrective or reversal move. Therefore, when a “W” Renko chart pattern is spotted, we always take a short position as described below.
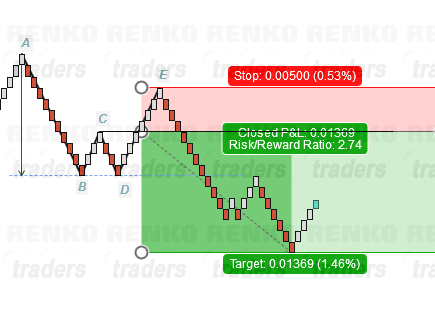
- When the “W” pattern is qualified after noticing bearish reversal Renko bricks, short at C
- Either wait for a bearish Renko brick to form below C which makes it a safer entry or place a pending sell order at C
- Stop loss for the short order comes in at E
- Target for the “W” pattern is a measure of the leg A, B projected from C
The image below shows how the “W” Renko chart pattern would be traded.

Risk Management – “W” Chart Pattern
The overall risk management with “W” chart pattern offers a minimum of 1:2 RR. This strategy itself makes the case for a robust trading strategy where the risk to reward is always greater, thus making it a very reliable pattern to trade that also comes with good RR.
Renko Chart Patterns “W” – Examples
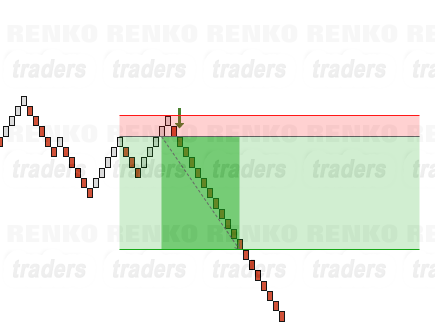

The “W” chart pattern on Renko charts makes for a reliable reversal indicator. It is highly profitable and the risk/reward is at the minimum 1:2. The only problem with the “W” chart pattern is catching it at the right time. However, because this pattern works off any renko box size, traders can randomly scan and set up the charts where they can anticipate a potential “W” pattern being formed.