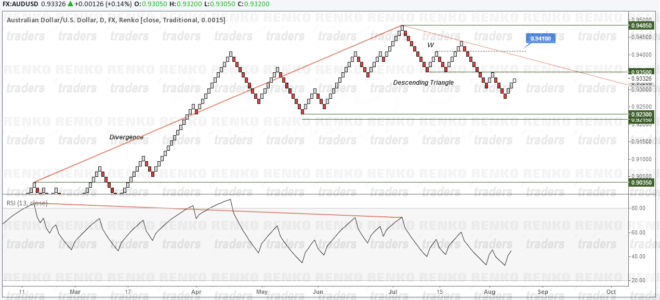
The AUDUSD Renko charts paints a very bearish picture for the Aussie Dollar. The latest RBA minutes could not cap any gains as the AUDUSD, at the time of writing has been pushing higher.
The Renko chart we use for this AUDUSD renko analysis is a 15pip fixed box size renko chart and there are quite some bearish signs on the chart.
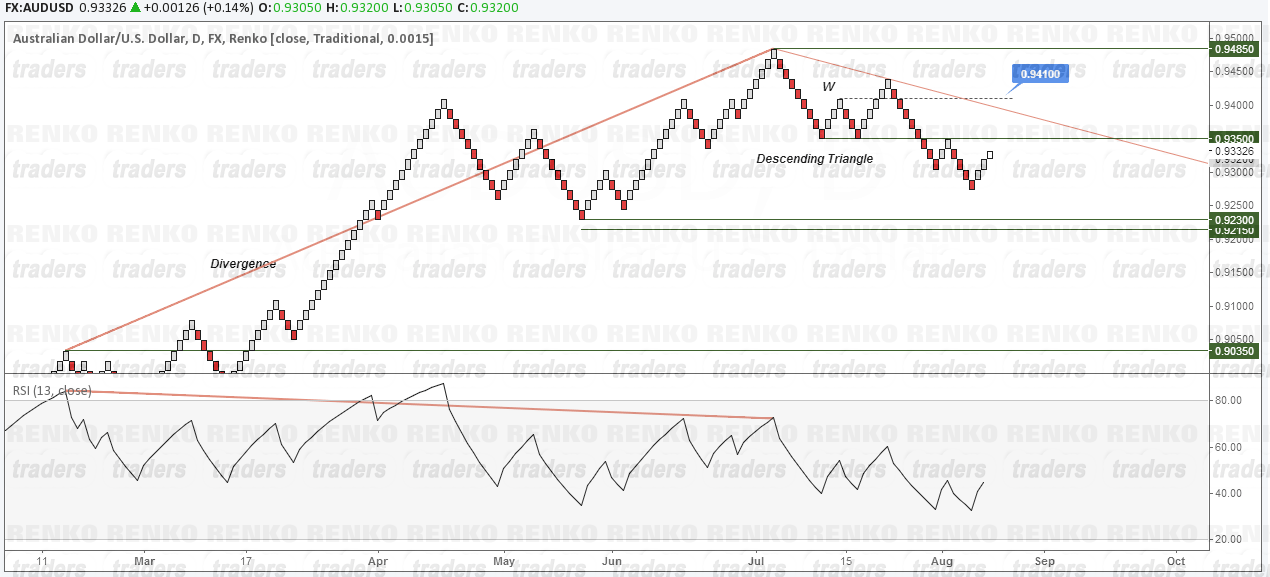
- The “W” pattern that was formed, reached its target, so the current rally can be seen as a retracement to the down trend.
- Taking cues from the support at 0.935, we notice a descending triangle formation, which gives us a target of 0.923 – 0.9215
- If we zoom out the chart a bit, in relation to the RSI we notice a major bearish divergence in place which gives a downside target of 0.9035
Trading AUDUSD with Renko Charts
The game plan would be to look for selling the rallies. As per the ‘W’ pattern, a short entry would have been initiated at 0.941. The support, which could now turn to resistance falls at 0.935, which is the potential level to look for shorting AUDUSD.
However, as with Renko charts, we need to see a close at 0.935 before even thinking of any short positions. The cues might from today’s fundamentals such as the US inflation data. The headwinds or downside risks to the Aussie dollar comes from RBA governor Glenn Stevens who is scheduled to speak tomorrow.
Therefore, the ideal scenario would be to see a bullish rally close today at 0.935 which will set the stage for a continuation of the Aussie downtrend.
The immediate levels to target include 0.923 followed by 0.9035 with stops coming in at 0.941.