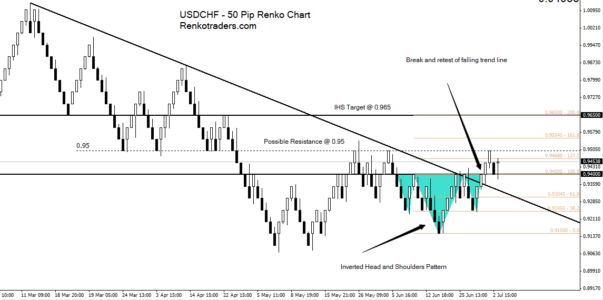
USDCHF – 50 Pips Renko Box Size
Renko charts analysis for USDCHF shows a break of the falling trend line followed up by a quick retest to the break out level at 0.94. Prior to the break out an inverted head and shoulders pattern was also formed, which gives an estimated target to 0.965.
Taking a long position at market would mean that stops need to be placed just below 0.93806. A fall back below the inverted head and shoulders neckline at 0.94 would invalidate the idea.
In terms of the risk/reward ratio, the above set up offers a favorable RR ratio (combined with the prospects of positive swaps).
There is a potential risk of reversal near 0.95 as that level has continued the rally in three separate occasions. Therefore, there is a risk for long positions, until 0.95 is cleared, which however could be used to book partial profits. At the same time, the 0.95 region could be another level to look to for adding new long positions while targeting 0.965.

Click on the image above to view an enlarged version along with the notes on the chart.
FTSE100
Following up from yesterday’s note, there hasn’t been much change as the 40 point Renko chart still shows price ranging near 6550. We remain biased for a rally towards 6640 with another position targeting 6700 preferably at break even.