Following the success of some of our best long term trades in 2015, we start off 2016 with GBPAUD which looks very promising.
GBPAUD has been in a steady uptrend over the past few years but the currency pair started to show signs of a top around late last year. Prices indeed topped out near 2.20 – 2.22 before steadily declining. A head and shoulders pattern was identified on the weekly charts which got many traders excited. However, as with any chart pattern, it takes time to evolve. After breaking the neckline near 2.08 – 2.09, GBPAUD declined strongly to form a new low near 2.02, which marks 161.8% measured move off the head and shoulders pattern. Prices promptly reversed off this low to head back to the neckline. Indeed, this is not the first time prices rallied back to the neckline. On previous occasion, there was a breach of the neckline with GBPAUD pushing as high as 2.11.
We have strong conviction that there is more downside to come. Inflation continues to plague the UK and with the average wage growth staying flat below 3.0%, the BoE will likely be in no rush to send any hawkish signals to the market.
For the Australian dollar, the risks come from China as the world’s second largest economy trades closely with Australia. Although these risks seem to have weakened somewhat there is still some risk no doubt. The Australian dollar has been on a wild ride but prices are back to the 0.70 level. The RBA is likely to remain on the back foot and keep a neutral stance, especially with the US rate hikes turning bullish for the US Dollar.
However, all said and done, there is a lot on the horizon and the fundamental landscape could change significantly over the months.
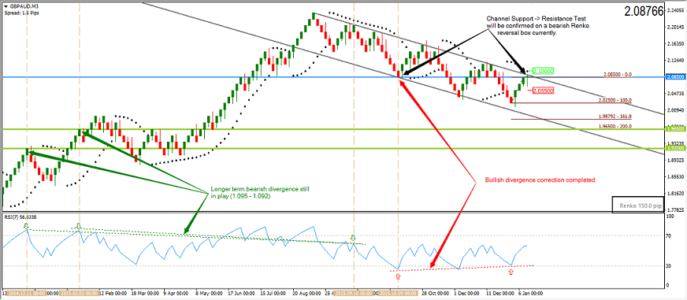
GBPAUD – Technical Analysis

We start our analysis with the 150Pip Renko chart and make use of the Parabolic SAR pullback trading strategy. Prices remain in a downtrend currently but trading close to 2.10. The current 2.085 is a key level in our opinion as it marks the support/resistance level of the price channel. If resistance is established on this price point, we could expect a renewed downtrend to continue. In line with the PSAR trading rules, a bearish renko reversal near 2.085, which should see a confirmation at 2.055, could signal the new bearish trend. We expect a test to 1.0965 if things go to plan.
Further adding to our view is the strong bearish divergence that has been built up as well, with 1.0965 – 1.092 being a key level where GBPAUD can establish support. The current rally can be explained with the bullish divergence that was formed, which was filled with price testing 2.085.
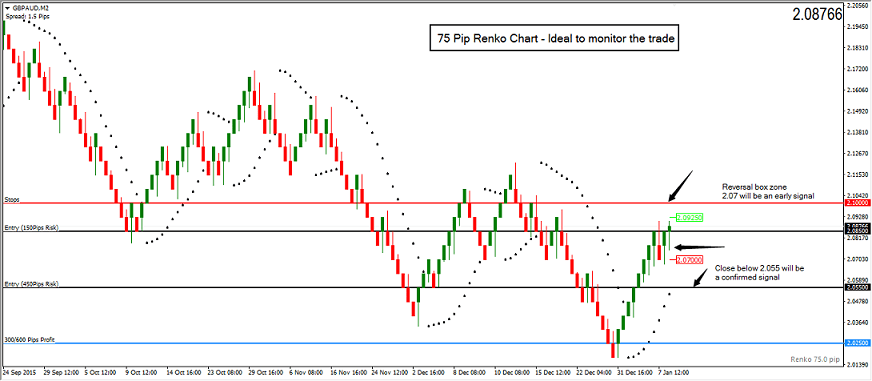
On the 75 Pip Renko box size chart, plotting the levels off the 150 Pip box chart, we identify two potential levels for entry, 2.085 and 2.055, with stops for both coming in at 2.10. To the downside, we expect a decline to 2.025 as the initial profit level followed by 1.965.
In terms of risk, we look at the following:
- Entry at 2.085 offers 150 Pips risk with 600 Pips first profit @ 2.0250 and 1200 Pips second profit @ 1.095
- Entry at 2.055 offers 450Pips risk with 300 Pips first profit @ 2.025 and 600 Pips second profit @ 1.095