Continuing the analysis from earlier this month in February, the S&P500 Index continues to show signs of exhausting momentum to the upside. Since publishing the previous analysis, the S&P500 Index has not seen any major changes to price. Stuck above the support level of 1850 the double top remains well in place while price is starting to show signs of a move to the 2000 level.
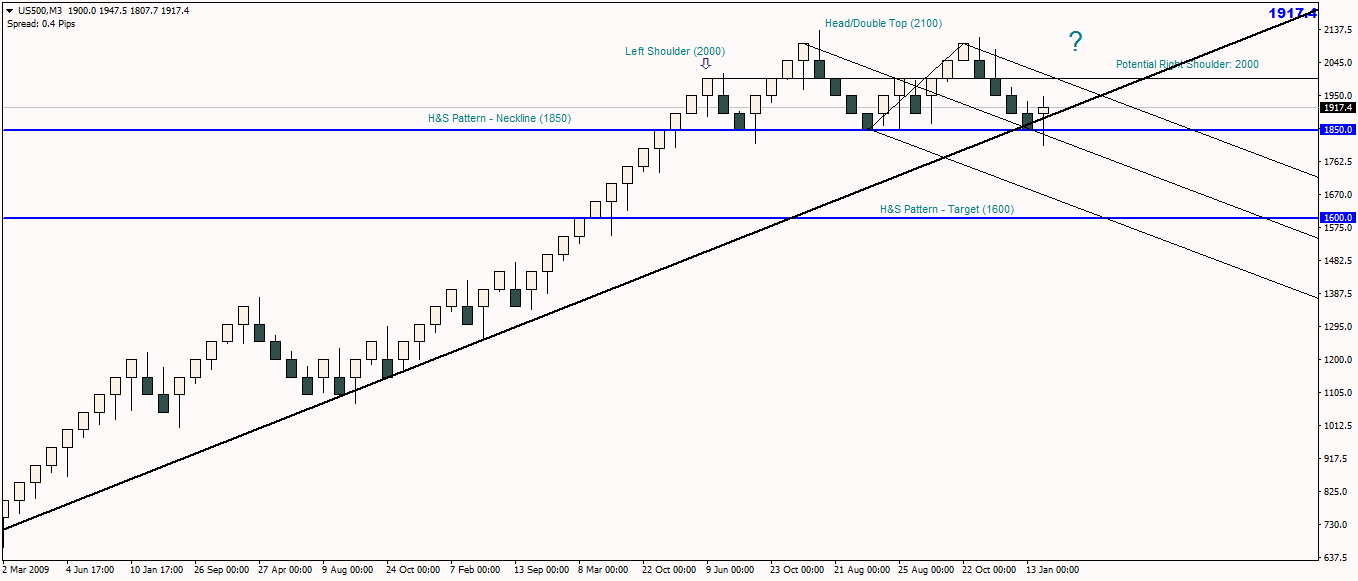
The updated Renko chart for the S&P500 Index below (50 Point chart) shows price attempting to push higher. Our focus at 2000 remains in place as we expect to see a potential right shoulder being formed as part of the (not so perfect) Head and Shoulders pattern.
While 2000 is the price level to the upside, 1850 is the key support, which if gives way could see a potential decline lower with 1600 coming in as the next main support. The fact that the upside momentum is slowly giving away is also established by the fact that the reversal near the trend line is currently happening. Only a close above 2000 could signal a potential resumption of the uptrend.
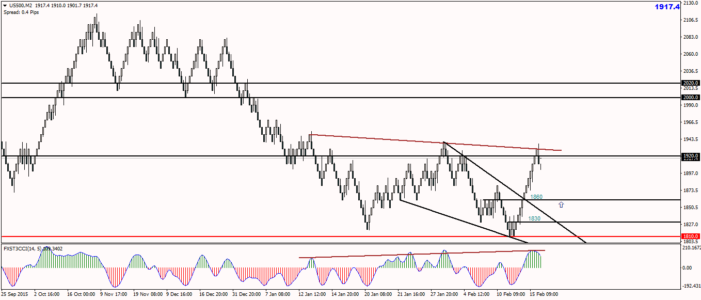
On the other hand, when we zoom in to a lower brick size Renko chart for the S&P500 (10 points in this case) we notice that there is another leg down that is pending. This is based on the fact that price action is currently in a hidden bearish divergence with the lower high at 1910 resulting in the oscillator making a higher high and also confirmed by the reversal Renko bar near this region.
A decline lower will find support near the 1860 region and a decline lower could see a further fall to 1830 which would potentially mark the retest of the bullish divergence that was formed. A close below 1810 would of course invalidate the bullish bias.
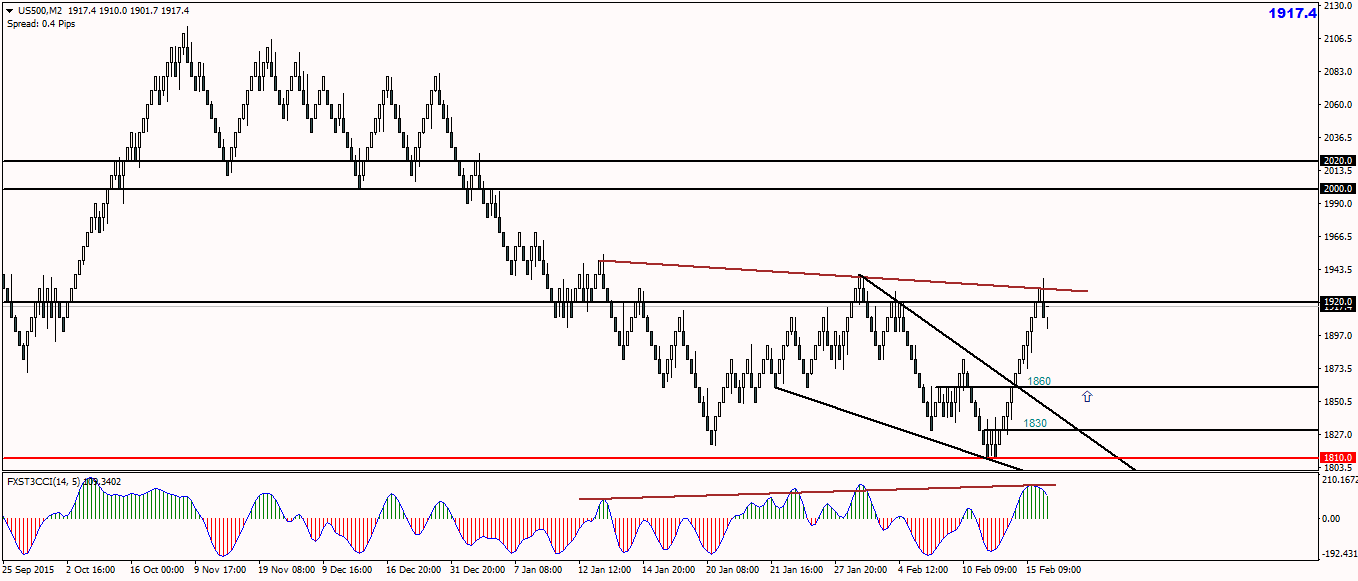
When the hidden bearish divergence is corrected, we expect to see prices rallying off the 1860 (or 1830) level most ideally, which should eventually see a test to 2000 – 2020 region.
The S&P500 Renko analysis eventually points to the fact that the US equity markets might be in for a rough time ahead as the marktes are likely to test 1600 before showing any signs of further upside.