Picking retracements into a trend can be considered one of the safest ways to trade. With the overall trend being identified, picking the turning points such as buying the dips in an uptrend or selling the rally in a downtrend can be an ideal way to trade the markets. In this Renko trading strategy, we make use of price action and the parabolic SAR indicator to pick the trends.
Traders can of course, add two moving averages as well if you want to be sure of the prevailing trend (this also helps in an important aspect which is mentioned later). This Renko trading strategy works on any Renko box size although 10 – 15 pips box size is considered ideal. In terms of the risk/reward ratio, the set up offers a tight risk while the take profit levels can be adjusted based on one’s analysis.
Note: This strategy should not be confused with another Renko trading strategy that uses Parabolic SAR indicator.
Renko Chart parabolic SAR retracements
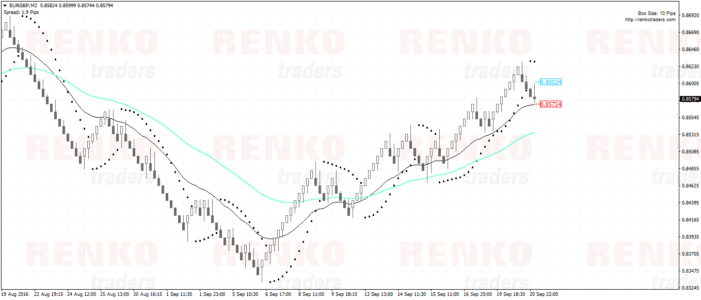
The first step is in adding the parabolic SAR with the default 0.02/0.2 settings. Once the indicator is added, most of the work is based on price action to determine the trend. Simply scan the chart to see how price is evolving. Is price making lower highs and lower lows? Then that could be a downtrend. If price is making higher lows and higher highs, then that would be an uptrend.
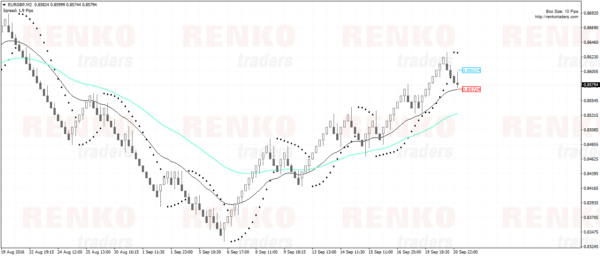
The chart below shows the set up here with the Parabolic SAR. Looks simple right?
Also, the box size here is of utmost important. But what Renko box size to choose?
To answer this, you need to experiment with different box size. The goal is in coming up with a box size where the trends are well exhibited.
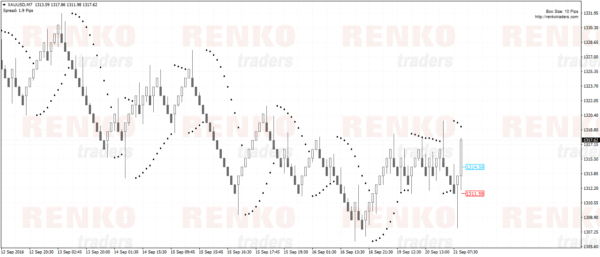
In the next chart below, we have a 10 point Gold Renko chart. you can see how price action here is very choppy.
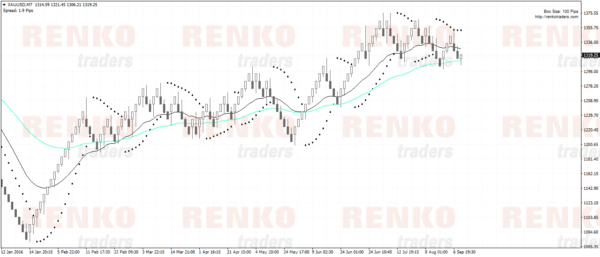
So the obvious step is to switch to a higher box size. Let’s see if a 100 pip Renko chart for Gold will show better trends.
Here, we can see that the trends are a lot clearer, but pay attention to the position size as 100 points in gold can be expensive especially in setting your stop losses.
Renko Chart parabolic SAR retracement strategy rules
Buy Rules:
- Identify an uptrend. Look for higher highs and higher lows. You can also add two moving averages to confirm the trend. The trick is in trading the first pullback to gain an early lead into the trend
- Wait for price to make a high before it starts retracing and mark this level
- During the retracement, the PSAR is now below price. Wait for price to break the previous retracement.
- Once the previous retracement is broken, wait for price to fall back to this previous high
- Look for a bullish Renko reversal pattern, preferably an engulfing pattern
- Buy on the bullish close with stops at the low near this retracement
- Set target to two or three Renko boxes and once the first target is reached, move the position to break even. From here on you can book profits or continue into the trend
Sell Rules:
- Identify a downtrend. Look for lower lows and lower highs
- Wait for price to make a low before it retraces and mark this level
- Then wait for price to break this low and wait for price to pull back to this previous low
- Look for a bearish reversal pattern here and sell on the bearish close with stops at the recent Renko brick’s high
- Set target to two or three boxes and move stops to break even when the first target is reached
- For the remainder of the trade, you can book profits at regular intervals or simply trail your stops
Renko Chart parabolic SAR retracement strategy examples
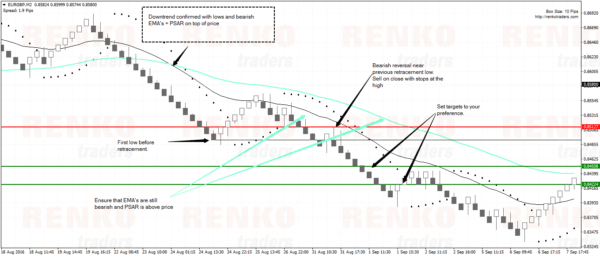
This is a perfect text book set up.
We first had the EMA’s signaling a bearish trend which is also confirmed by the PSAR printing above price. Then price hits a low and starts to retrace. This level is marked by the black horizontal line.
Then, this previous low is broken and price quickly makes a bearish reversal here. We sell at the bearish close with price at the high and targets set to your preference.
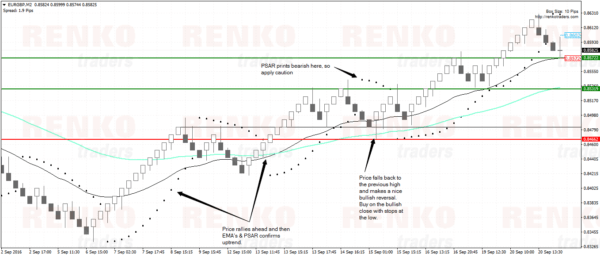
This next chart shows some variation to the trend. Here, we see prices quickly rallying. Price action traders would have identified the uptrend already, which is confirmed by the bullish EMA crossover. The retracement high is marked and we wait for price to fall back to this level to make a bullish reversal.
On closer observation you can see that the first pullback made a low to the price level. This is not the ideal entry. It is essential that you see a reversal at the price level, as marked on the chart.
Renko PSAR Retracement Strategy
The Renko PSAR retracement strategy is quite simple as it sounds. However in real time trading, prices don’t exactly move the specified number of pips at the retracement level. A bit of familiarity with the trading strategy is required to therefore capture these moves.
Overall, the Renko PSAR retracement strategy offers tight stop loss and a good entry point into the trade. It is an open system as far as booking profits are concerned.

