Renko charts can offer a great way for traders to identify trends in the market due to their smooth plotting of price. Likewise, the ADX or Average Directional movement index or Average directional index is an oscillator that is used to identify trends as well.
Combining the ADX to the Renko charts offers traders a simple yet robust trend following Renko trading system with minimal analysis required. This ADX Renko trading system can be traded as a standalone Renko trading system and at the same time can be combined with other Renko trading methods such as RSI divergence, Renko price action patterns and so on.
In this article, we’ll explore how to trade this simple strategy using Renko charts and ADX oscillator.
ADX Renko Trading Strategy – Chart Set ups
For this Renko trading strategy, we simply make use of the ADX oscillator, defined to 13 or 14 periods. We do not make use of the ADX line but focus only on the +DI and –DI lines.
Traders familiar with ADX oscillator will acknowledge that the +DI, in relation to –DI shows the prevailing underlying trend. In this ADX Renko trading strategy, we simply use the ADX’s + and – DI crossovers to enter long or short in the trade.
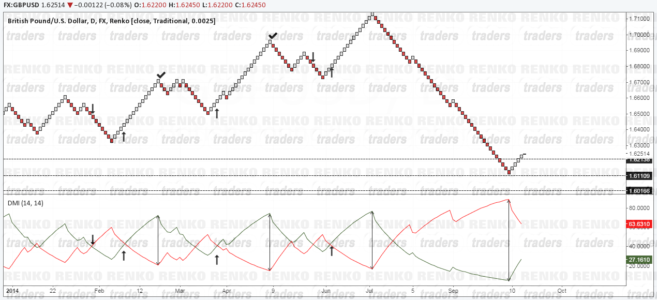
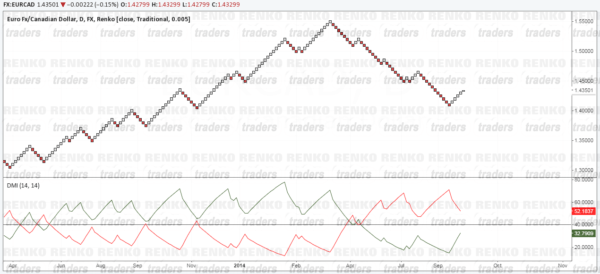
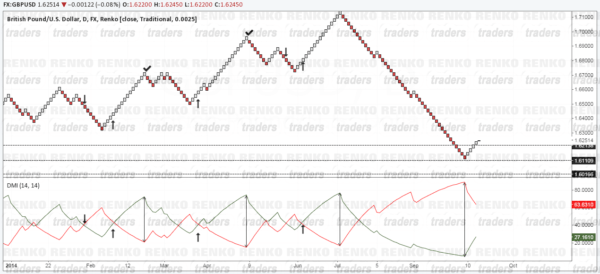
The chart above shows how the ADX Renko trading system charts look like. Simple isn’t it? The box size for this ADX Renko strategy can be up to the trader, whatever they are comfortable with. The only requirement is that there needs to be a fixed box size as the ADX could change values based on the Renko chart that is rendered if set to the dynamic ATR box size.
ADX Renko Buy/Sell Rules
In the simplest of sense, in this strategy buy when ADX’s +DI crosses above –DI and sell when ADX’s +DI crosses below –DI. However, we introduce support/resistance lines from the past to fine tune the entries.
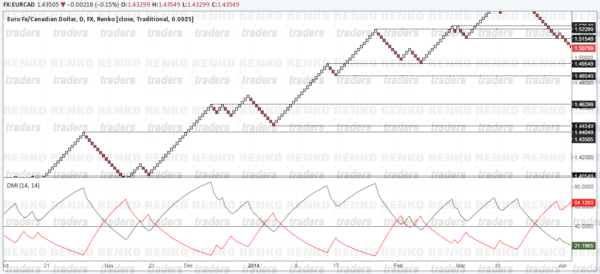
In the first chart below, notice how we plotted support/resistance levels ahead of price.
Now, we simply wait for price action to unfold and focus on the + and – DI crossovers.
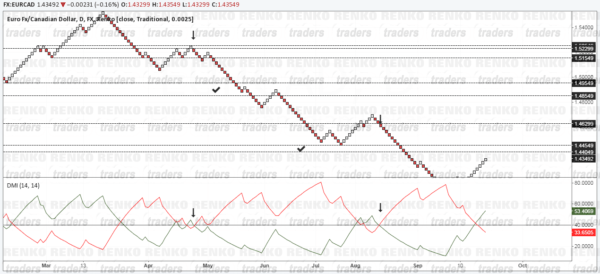
The next chart shows how the ADX is used to enter short once support levels are broken, confirmed by the downtrend established by the Renko chart and confirmed with the ADX indicator. Targets are set to the immediate support levels, while past support levels that have been broken and being tested for resistance can be used to re-enter short trades.
Another way to trade with the ADX indicator on Renko charts is based on the convergence and divergence of the + and – DI. The following chart illustrates the buy/sell rules based on ADX and Renko charts. The only difference here is that instead of closing a trade after a support or resistance levels in reached, here traders are closed when the + and – DI levels are at their extreme and start to converge again, sloping up or low.
ADX Renko Trading strategy – Conclusion
The ADX Renko trading method is probably one of the simplest of trading strategies with Renko Charts. Targets can be set to a predetermined support and resistance levels or alternatively used when the + and – DI levels divergence to the extremes and start to converge again.
This trading system relies completely on the trend and because Renko charts already show trends in prices, the ADX indicator only qualifies the trend and offers entry points into the trend.

